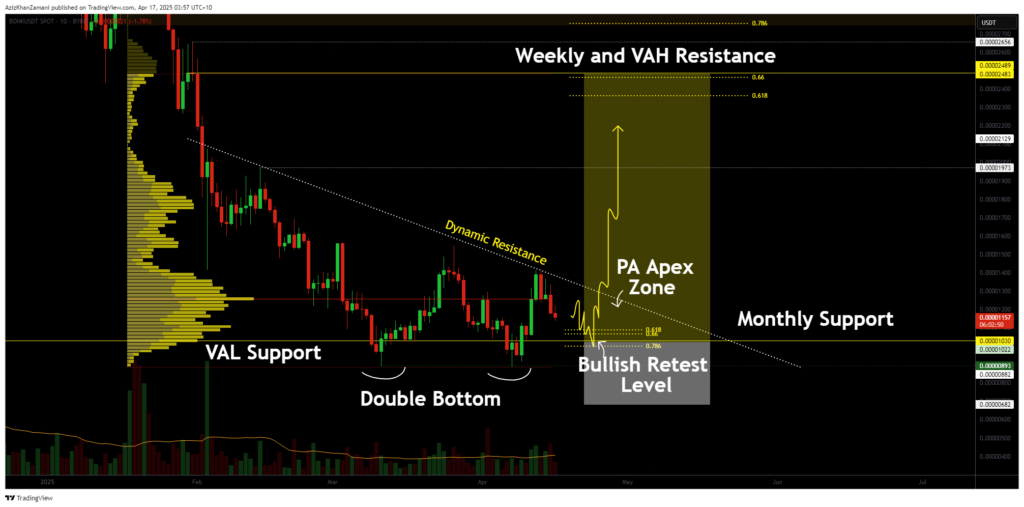
BONK is trading at a key high time frame support level while showing signs of a potential trend reversal. A double bottom formation is developing, and a breakout above dynamic resistance could confirm a shift in market structure, setting the stage for a bullish rally.
After a prolonged bearish trend marked by consecutive lower highs and lower lows, BONK (BONK) is now trading at a crucial decision point. The asset has respected a significant support level twice, forming what may develop into a double bottom formation. However, confirmation is still pending and depends on the next few weeks of price action. The market now awaits a breakout from the apex zone, where resistance and support are converging tightly.
Key points covered
- BONK has printed a potential double bottom formation after a bearish downtrend
- The current support level has held twice to the dollar, indicating potential strength
- A confirmed breakout through dynamic resistance would signal a bullish shift

Price action has repeatedly tested the value area low support, resulting in two significant bounces. This has created the potential for a double bottom pattern, often seen as a classic reversal signal. However, without a bullish higher low and breakout, the pattern remains unconfirmed.
Currently, price is squeezing into an apex zone, a point where monthly support and dynamic resistance converge. This tightening price action often precedes major directional moves. For BONK, a break above the dynamic resistance line would mark a structural shift from bearish to bullish on the daily time frame. This would confirm the double bottom and suggest the downtrend is potentially over.
For the breakout to hold validity, volume confirmation is crucial. A strong move through resistance, supported by increased volume, will likely lead to a push toward weekly resistance and value area high levels. Until this occurs, traders should watch for further consolidation within the apex zone.
What to Expect in the Coming Price Action
In the short term, expect BONK to continue ranging within the apex zone. A daily higher low forming near the monthly support could signal early strength. If price breaks above the dynamic resistance with strong volume, it may kick off a bullish rally toward the weekly resistance region. On the flip side, a breakdown below support would invalidate the current structure and likely lead to lower price targets.

