

Solana price held near $95 on Aug. 24 after gaining roughly 26% as regulatory optimism, record tokenized-asset value and active network governance votes supported the rally.
Summary
- Solana price gained about 26% after breaking above the former $78 resistance level.
- SOL faces daily resistance between $97.68 and $98.44 after briefly reaching $102.88.
- Validators are voting on proposals covering governance, inflation, and transaction fees.
- Liquidation liquidity is concentrated near $96.30, with another cluster around $93.
Solana price action today
According to data from crypto.news, Solana (SOL) price traded at $94.71 at press time on Aug. 24. The token had risen from around $75 before accelerating above $78 on Aug. 19.
On the 4-hour chart, SOL extended the breakout through $83.49 and $88.06, corresponding to the 50% and 61.8% Fibonacci retracement levels measured from $64.09 to $102.88. The rally briefly carried the price above $100 before sellers forced it back toward $88.
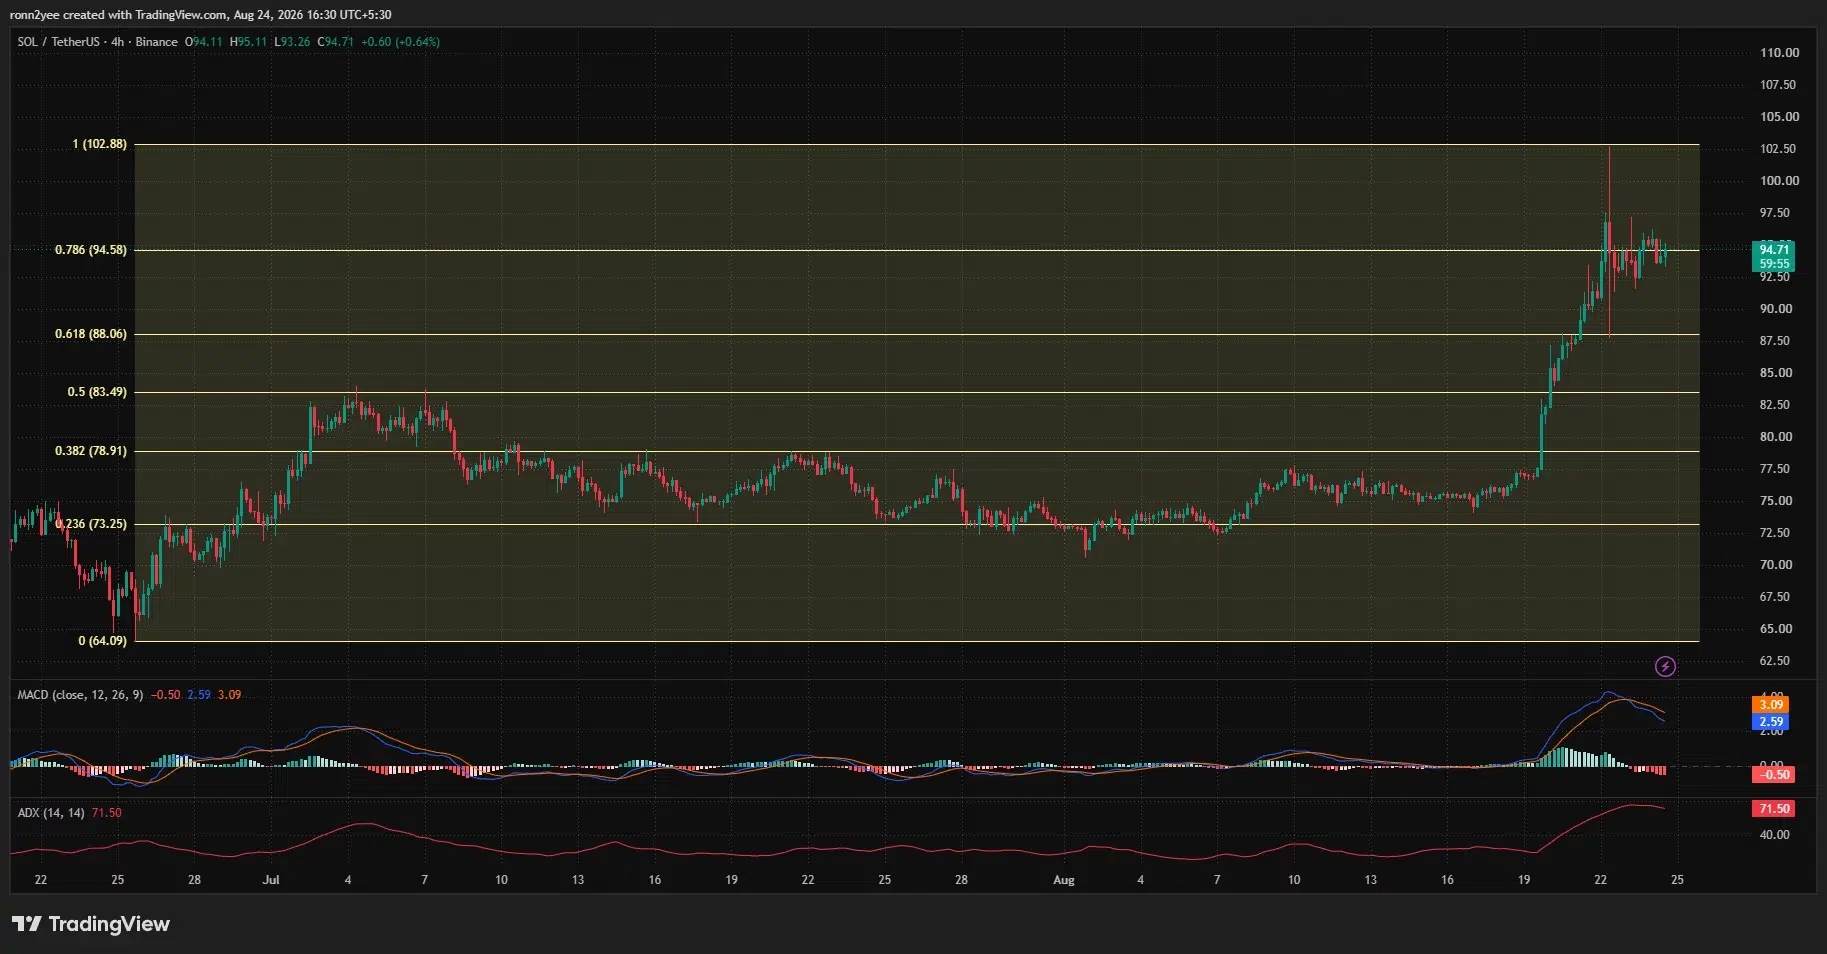
Buyers subsequently defended the pullback and returned SOL to the $94.58 Fibonacci level. Price was consolidating slightly above that mark at the time of the chart capture, leaving the market near the upper end of its two-month range.
The daily chart shows SOL trading above its 20-, 50-, 100-, and 200-day moving averages. Those averages were positioned between $76.56 and $81.27, showing how far the price moved from its recent trend levels during the rally.
SOL’s advance also followed a wider crypto recovery. Bitcoin and crypto-linked U.S. stocks rose after the Treasury expanded its long-duration debt buybacks and President Donald Trump renewed his push for the CLARITY Act.
What is driving the SOL rally?
The rally coincided with the U.S. Securities and Exchange Commission’s Aug. 18 proposal for a new framework called Regulation Crypto Assets.
The SEC said the proposed rules would give crypto companies clearer routes to raise capital under federal securities laws. The framework would also establish conditions under which certain crypto-related investment contracts could move outside existing securities requirements.
The proposal does not amount to a Solana-specific ruling or automatically remove every regulatory risk facing SOL. However, its publication reduced some of the uncertainty surrounding how U.S. securities rules may apply to functional blockchain networks and token offerings. Public comments remain open through Oct. 20.
Solana also received a network-specific catalyst when voting opened on its first three formal governance proposals. According to crypto.news, voting will remain open through epoch 1023, expected to end on Aug. 27 at approximately 15:30 UTC.
SGP-0001 would introduce the Solana Constitution as a common governance framework. SGP-0002 would double the network’s annual disinflation rate from 15% to 30%, potentially removing about 18.9 million SOL from scheduled emissions over six years.
SGP-0003 proposes a new resource and inclusion fee structure. SolanaFloor estimated that the change could raise daily SOL burning from about 648 tokens to roughly 9,000, although the outcome depends on validator approval and subsequent network activity.
Solana’s tokenized real-world asset market provided another source of support. RWA.xyz data showed that the value of tokenized assets on the network crossed $4 billion for the first time, while the number of RWA holders reached approximately 348,489.
SOL resistance sits between $97.68 and $102.88
SOL must first close decisively above the daily resistance zone between $97.68 and $98.44 to extend its recovery. The price tested the area during the latest rally but failed to hold above it.
A confirmed breakout would bring $100 back into view, followed by the Aug. 22 wick at $102.88. Clearing that high would remove the most visible nearby supply zone on the provided charts.
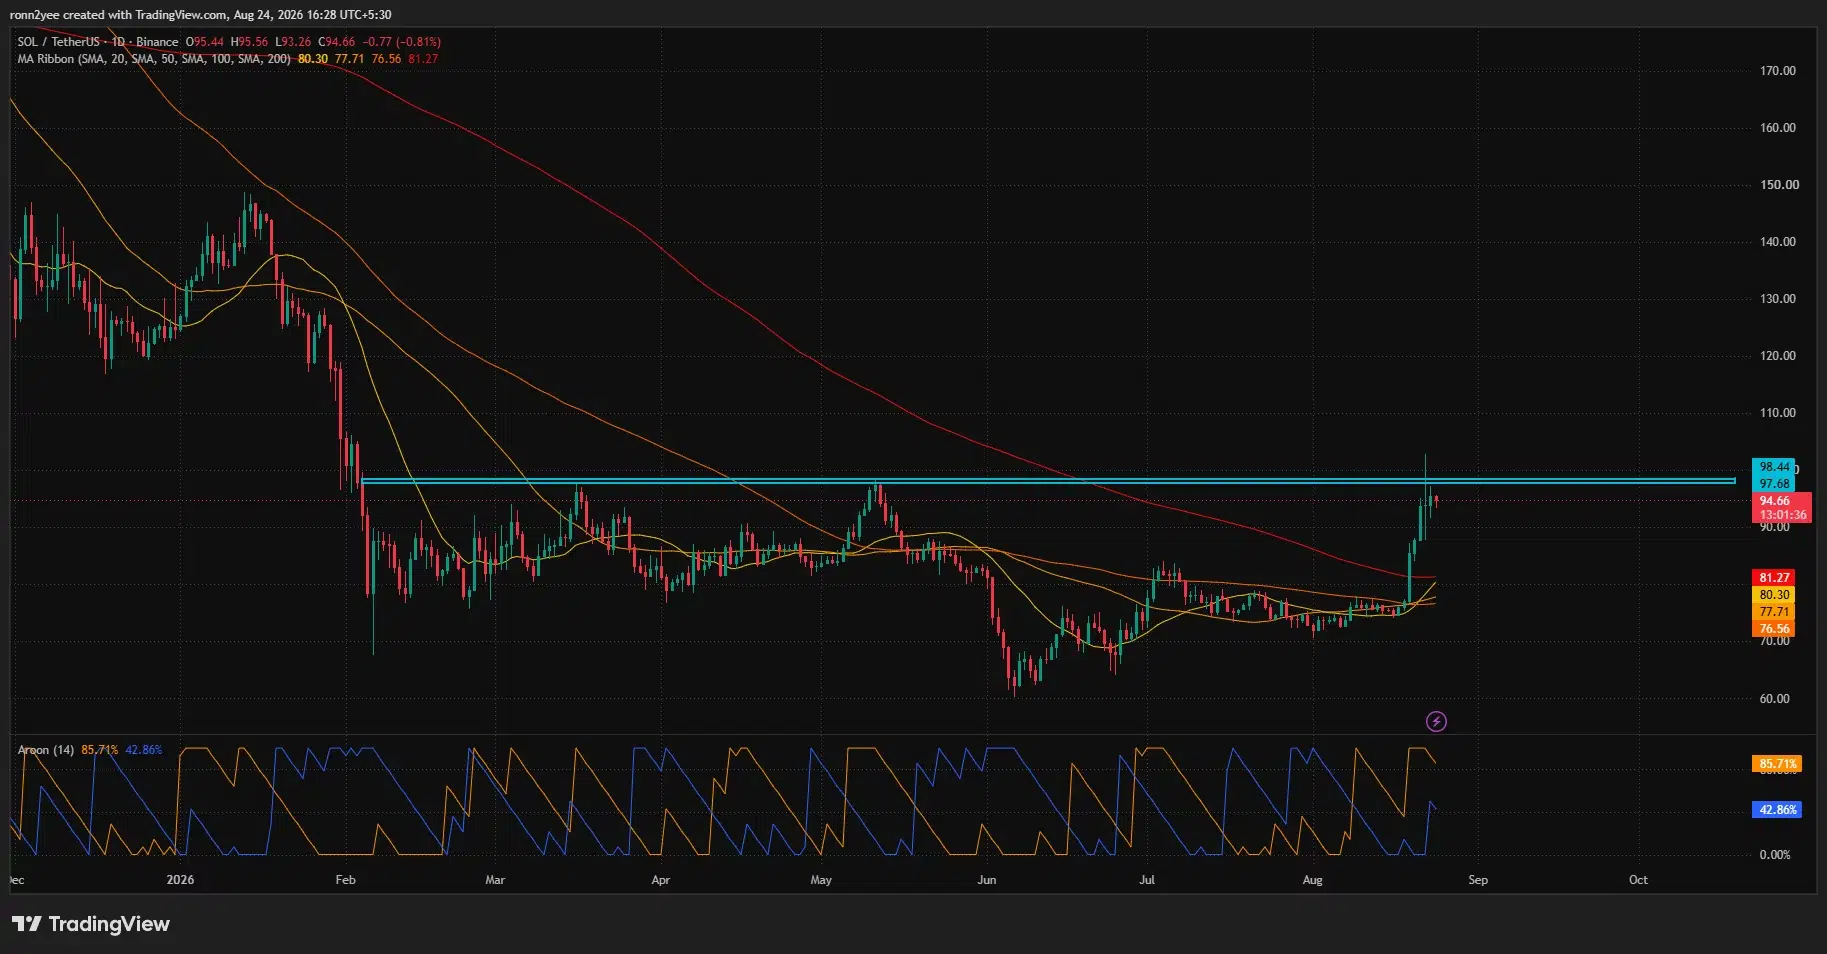
The Aroon indicator supports the broader bullish setup. Aroon Up stood at 85.71%, compared with Aroon Down at 42.86%, showing that a recent high carried more weight than the latest low.
Trend strength also remained elevated on the 4-hour chart, where the Average Directional Index registered 71.50. An ADX reading above 25 generally signals a strong trend, although the indicator measures strength rather than direction.
Short-term momentum has started to weaken. The 4-hour MACD line fell to 2.59, below its signal line at 3.09, while the histogram declined to minus 0.50. The bearish crossover suggests SOL may consolidate or retest support before attempting another breakout.
The first support sits near $94.58. A close below that level would expose the $92.50–$93.25 area, followed by $88.06. The deeper $83.49 level would become important if sellers reverse the breakout, while a move below $78.91 would materially weaken the current structure.
Liquidation map points to a battle near $96
CoinGlass’ 24-hour liquidation heatmap shows the largest nearby concentration of leveraged positions around $96.20–$96.40. Price often moves toward areas containing dense liquidation orders, but the map does not guarantee that SOL will reach or break the cluster.
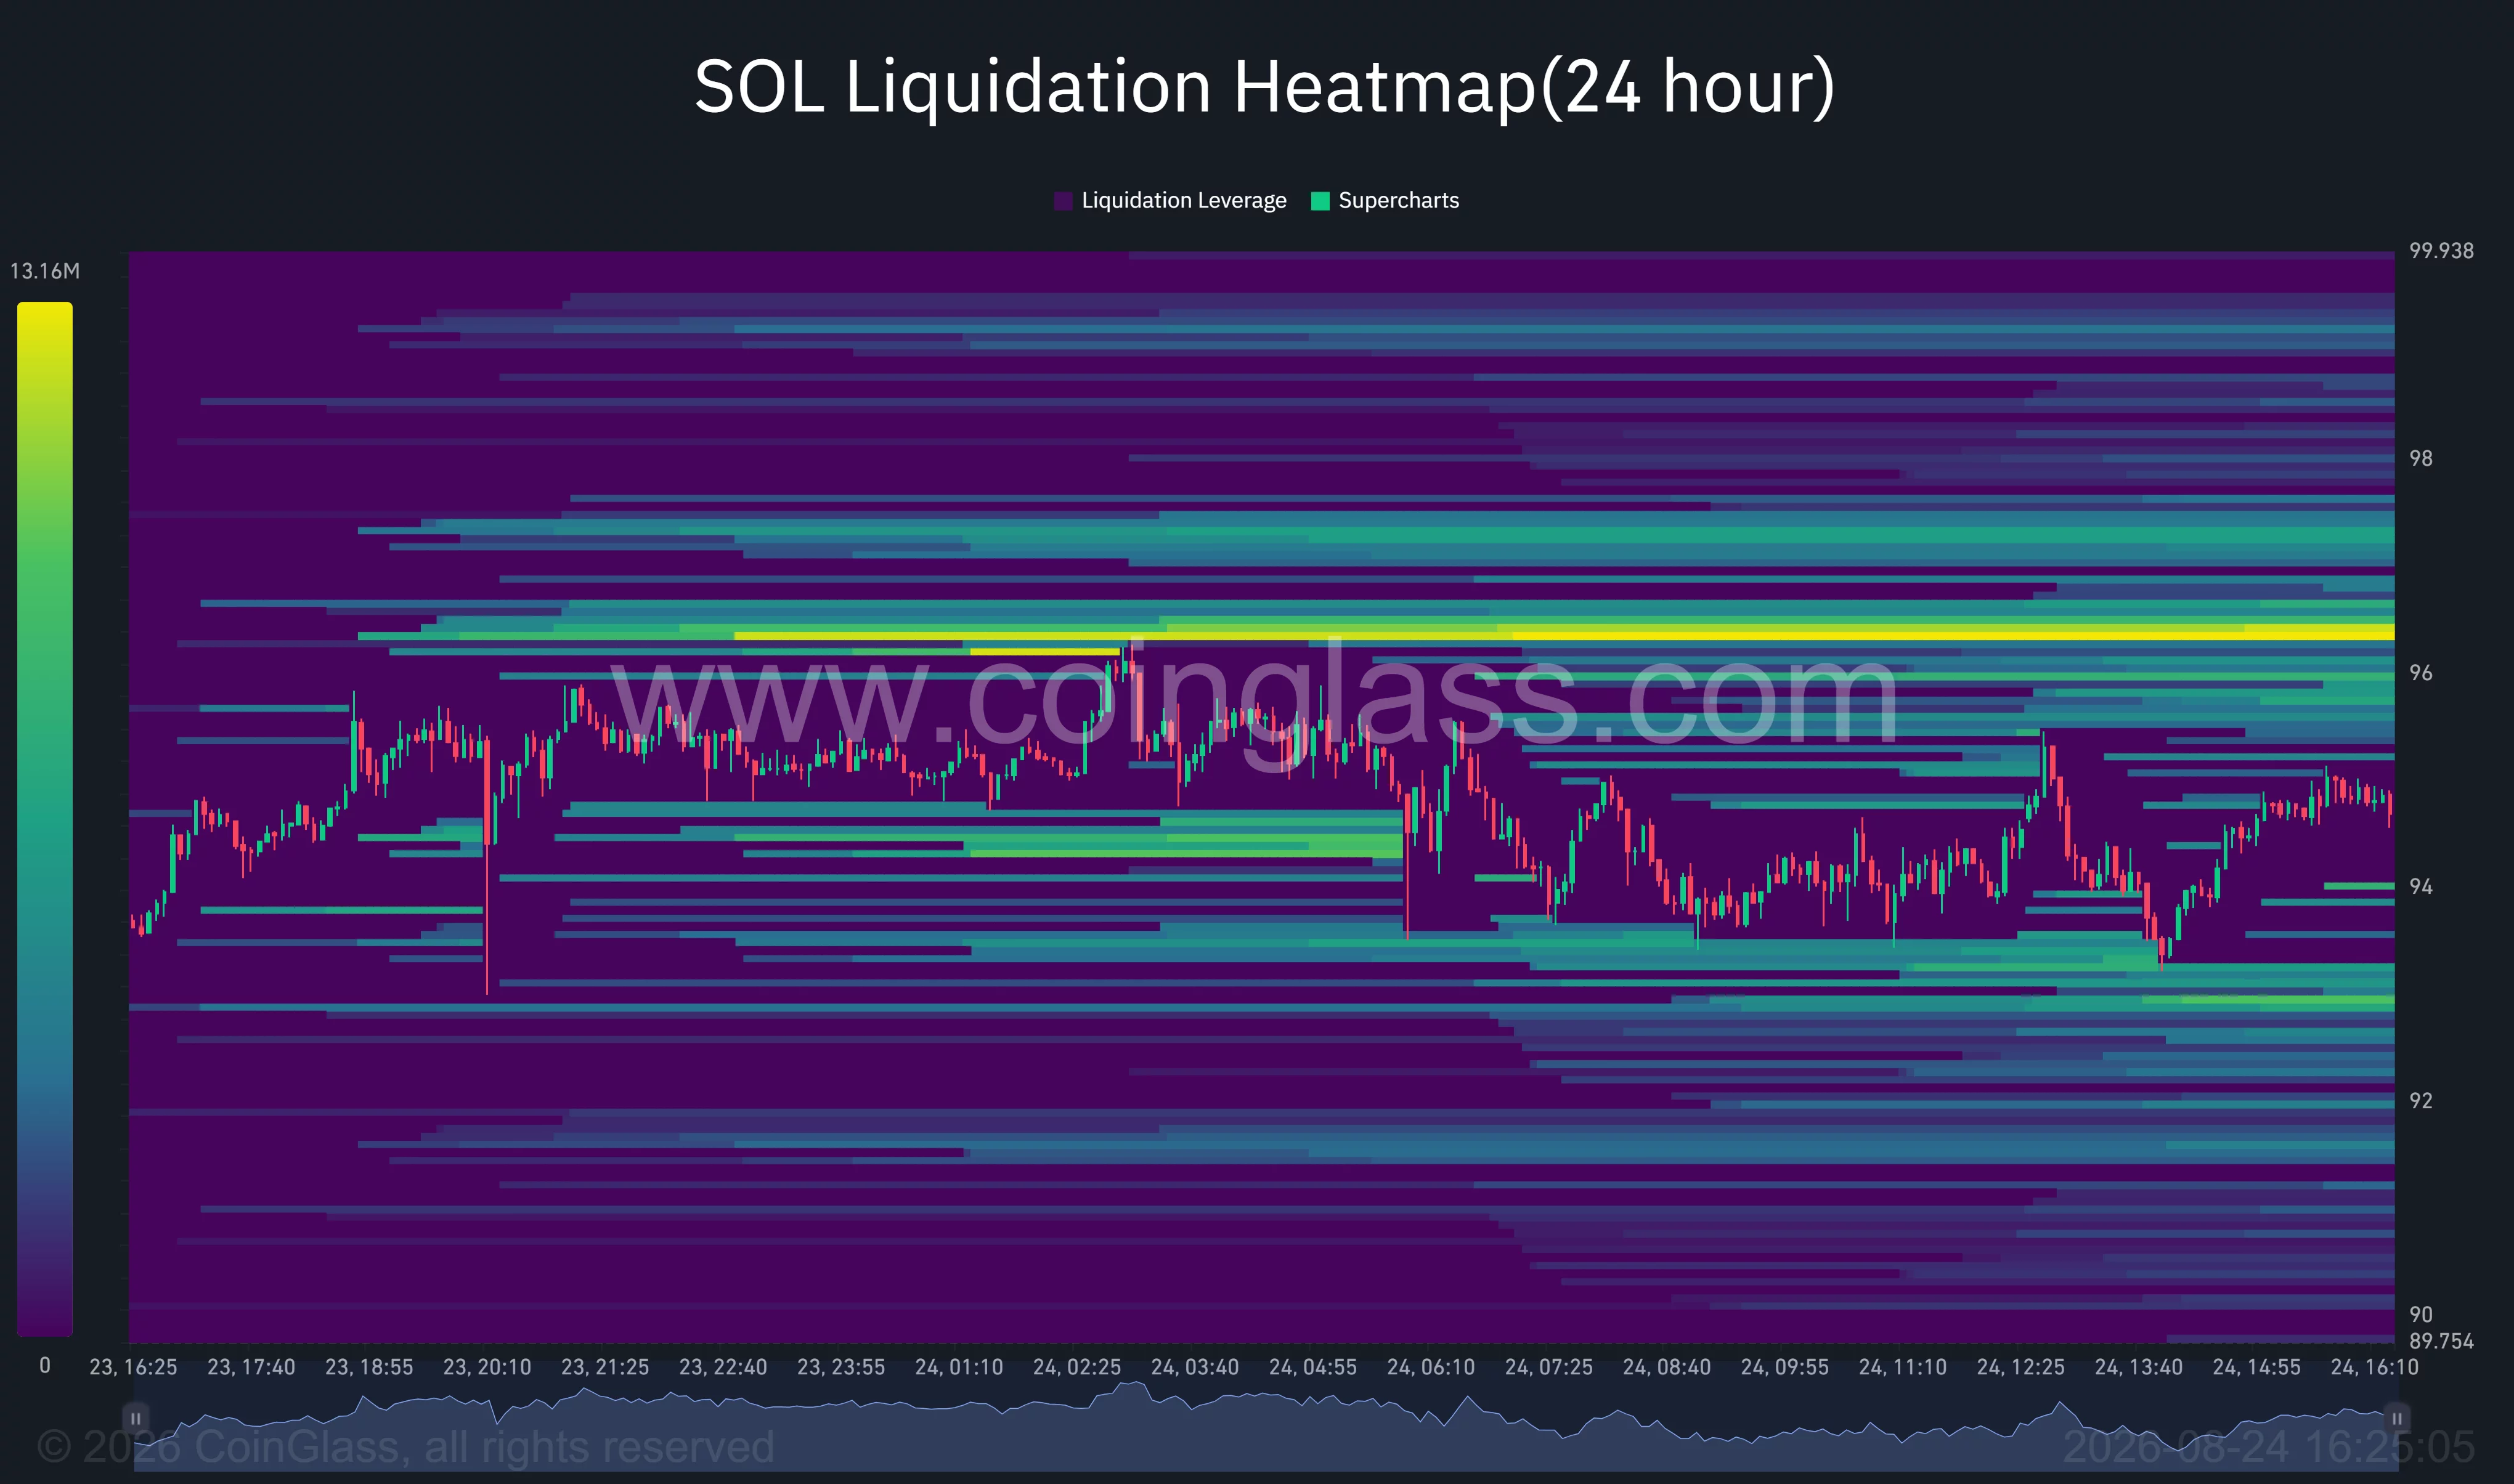
A move above $96 could force some short positions to close, potentially helping SOL retest the $97.68–$98.44 resistance zone. Further liquidity appears between approximately $97 and $99.50.
Below the market, liquidation concentrations are visible around $93 and from $91.50 to $92. A rejection below $94 could therefore produce a faster move toward those lower pools before spot buyers re-enter.
The chart does not support attributing the wider market’s reported multibillion-dollar liquidation total solely to SOL. Any such figure should be described as covering the broader crypto derivatives market unless CoinGlass provides an asset-specific total.
What analysts are watching next
Crypto analyst Haris identified the $98–$102 area as the main resistance zone after SOL’s latest rejection. The analyst said a break below $85 would weaken the setup, while the supplied daily chart places more immediate support at $88.06 and $83.49.
The governance vote may provide the next Solana-specific catalyst. Approval of SGP-0002 would reduce future token issuance faster, while SGP-0003 could increase the amount of SOL burned through network fees. Rejection would preserve the existing emission or fee structure.
For U.S. investors, the SEC proposal remains the larger policy event. The rules are still at the proposal stage and may change following public comments, meaning the recent rally reflects expectations rather than a completed regulatory change.
SOL’s ability to hold $94.58 while momentum resets will determine whether the move becomes a sustained breakout. A daily close above $98.44 would strengthen the bullish case toward $102.88, while a loss of $88.06 would raise the risk that the rally is unwinding.
Disclosure: This article does not represent investment advice. The content and materials featured on this page are for educational purposes only.
