

Ethereum price traded near $2,478 on Aug. 25 after gaining roughly 30% over seven days, but an overbought daily reading and concentrated liquidity around $2,500–$2,550 could decide whether the rally extends toward $3,000 or enters a deeper pullback.
Summary
- Ethereum price rose from about $1,916 on Aug. 19 to a seven-month high above $2,500.
- US spot Ethereum ETFs attracted $697.2 million during their strongest inflow week of 2026.
- The daily RSI reached 79.12, placing ETH firmly within overbought territory.
- A weekly close above $2,550 could open the way toward $2,700 and $3,000.
Ethereum price holds most of its 30% weekly gain
According to data from crypto.news, Ethereum (ETH) price was trading at approximately $2,478 at the time of writing, having eased from an intraday high of $2,532. The asset remains roughly 29% above its Aug. 19 opening price of $1,916.
The rally carried ETH through $2,000, $2,200, and $2,400 in less than a week, reversing a long period of subdued price action. Ethereum had largely traded between $1,800 and $1,950 during the first half of August before the breakout began.
The initial move coincided with an unusually large derivatives reset. CoinGlass data showed that short sellers across the crypto market lost nearly $2.7 billion within 24 hours, while total liquidations approached $3 billion. Ethereum accounted for about $1.1 billion of the forced closures, according to separate reports citing the same dataset.
Short covering helped accelerate the initial advance, but ETH has retained most of those gains after the liquidation wave faded. Price has consolidated between approximately $2,420 and $2,530 since Aug. 22 rather than returning to its pre-breakout range.
US ETF inflows support Ethereum demand
US-listed spot Ethereum ETFs recorded $697.2 million in net inflows during the five trading sessions through Aug. 21. It was their strongest weekly result of 2026 and their best performance since early October 2025.
The inflows matter because they show that demand extended beyond leveraged derivatives. US spot Bitcoin funds attracted another $1.918 billion over the same period, taking combined inflows for the two groups to approximately $2.6 billion.
The rally also followed the US Treasury’s Aug. 19 decision to increase the maximum size of its longer-dated bond buybacks. The department said operations covering 10-to-30-year securities would rise from $2 billion to at least $4 billion beginning Sept. 9, according to the official announcement.
Long-term yields declined after the announcement, with the 30-year yield moving from above 5.30% to around 5.19% at one stage. However, the buyback increase has not yet taken effect, meaning the announcement coincided with the crypto rally rather than representing an immediate injection of Treasury liquidity.
US regulatory developments supplied another possible sentiment boost. The Securities and Exchange Commission proposed two exemptions for certain investment contracts involving crypto assets, including a startup exemption of up to $5 million over four years and a fundraising route of up to $75 million annually.
Ethereum’s daily RSI warns of overheating
Ethereum’s daily chart has turned bullish after the price cleared all four major moving averages. ETH is trading above the 20-day simple moving average at $2,079, the 200-day average at $2,013, the 50-day average at $1,950, and the 100-day average near $1,877.
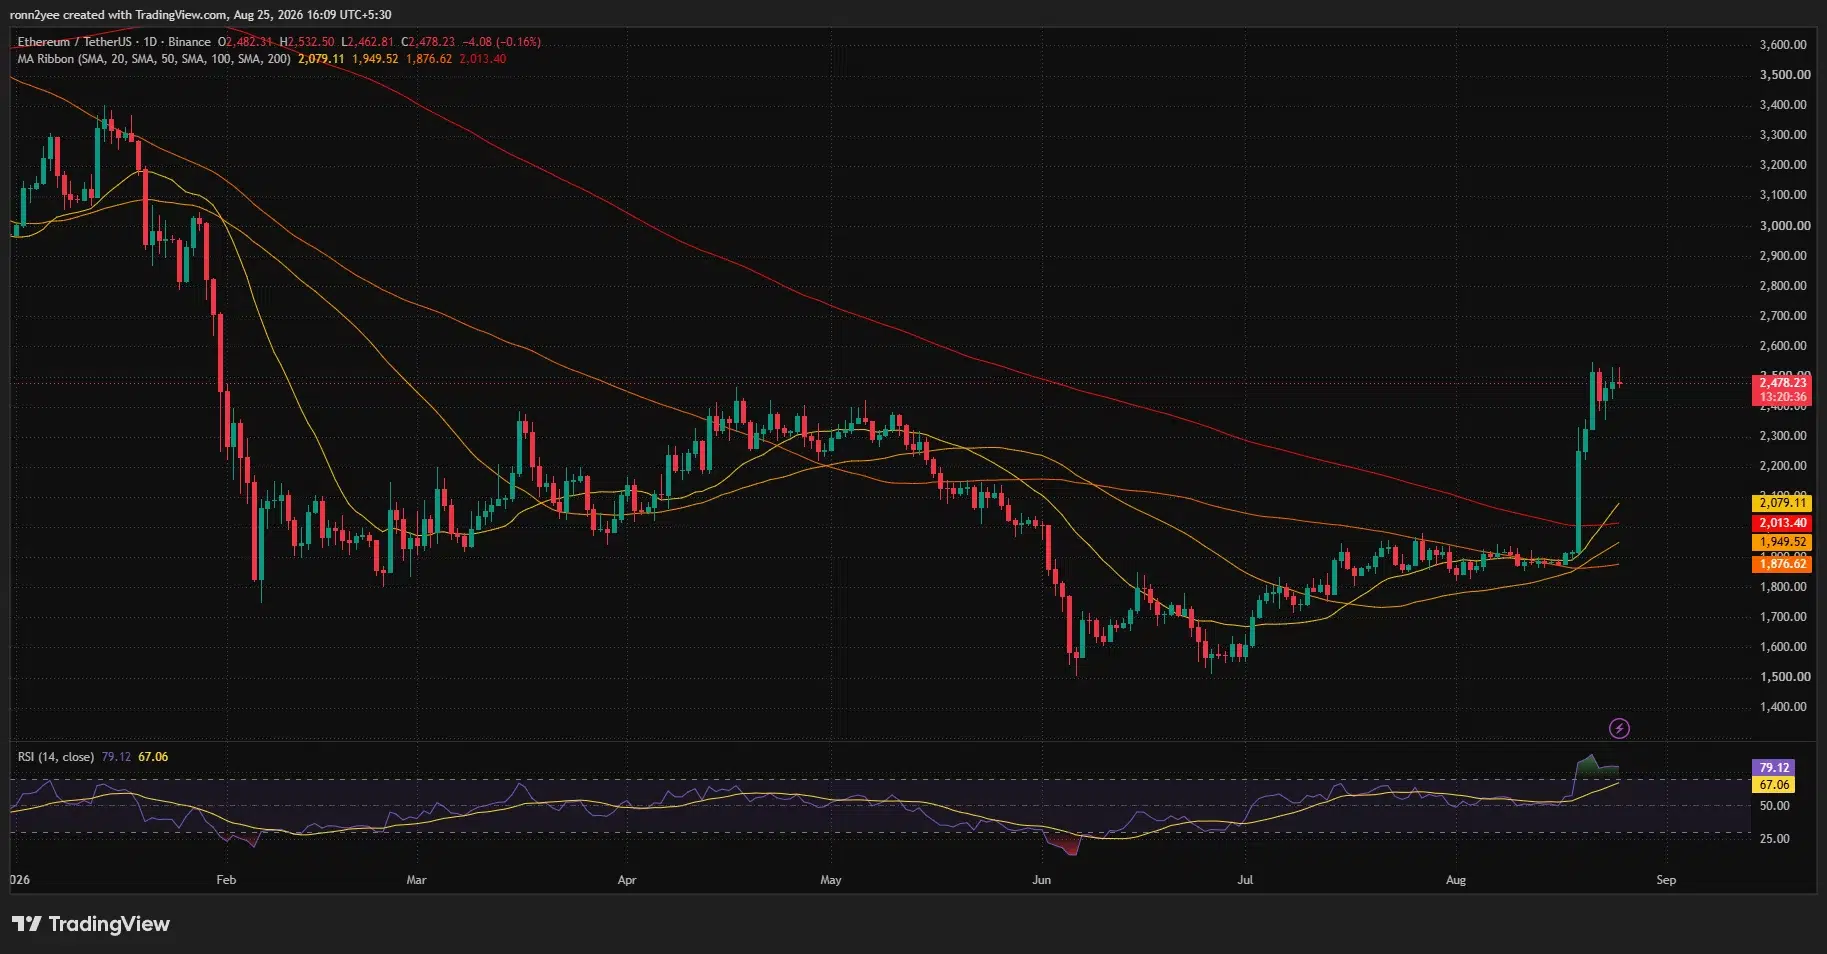
The ordering of those averages has not yet developed into a confirmed long-term bullish formation, but the breakout above the 200-day average removed one of the market’s most important technical barriers. The $2,000–$2,080 region could consequently serve as major support during a broader correction.
Short-term conditions look stretched. The daily relative strength index stood at 79.12, well above the conventional overbought threshold of 70. Its signal average had climbed to 67.06, showing that momentum remains strong even as the risk of profit-taking rises.
Overbought readings do not guarantee an immediate decline, particularly during a sharp trend reversal. However, they suggest that buyers may need fresh demand to carry ETH through the resistance concentrated above $2,500.
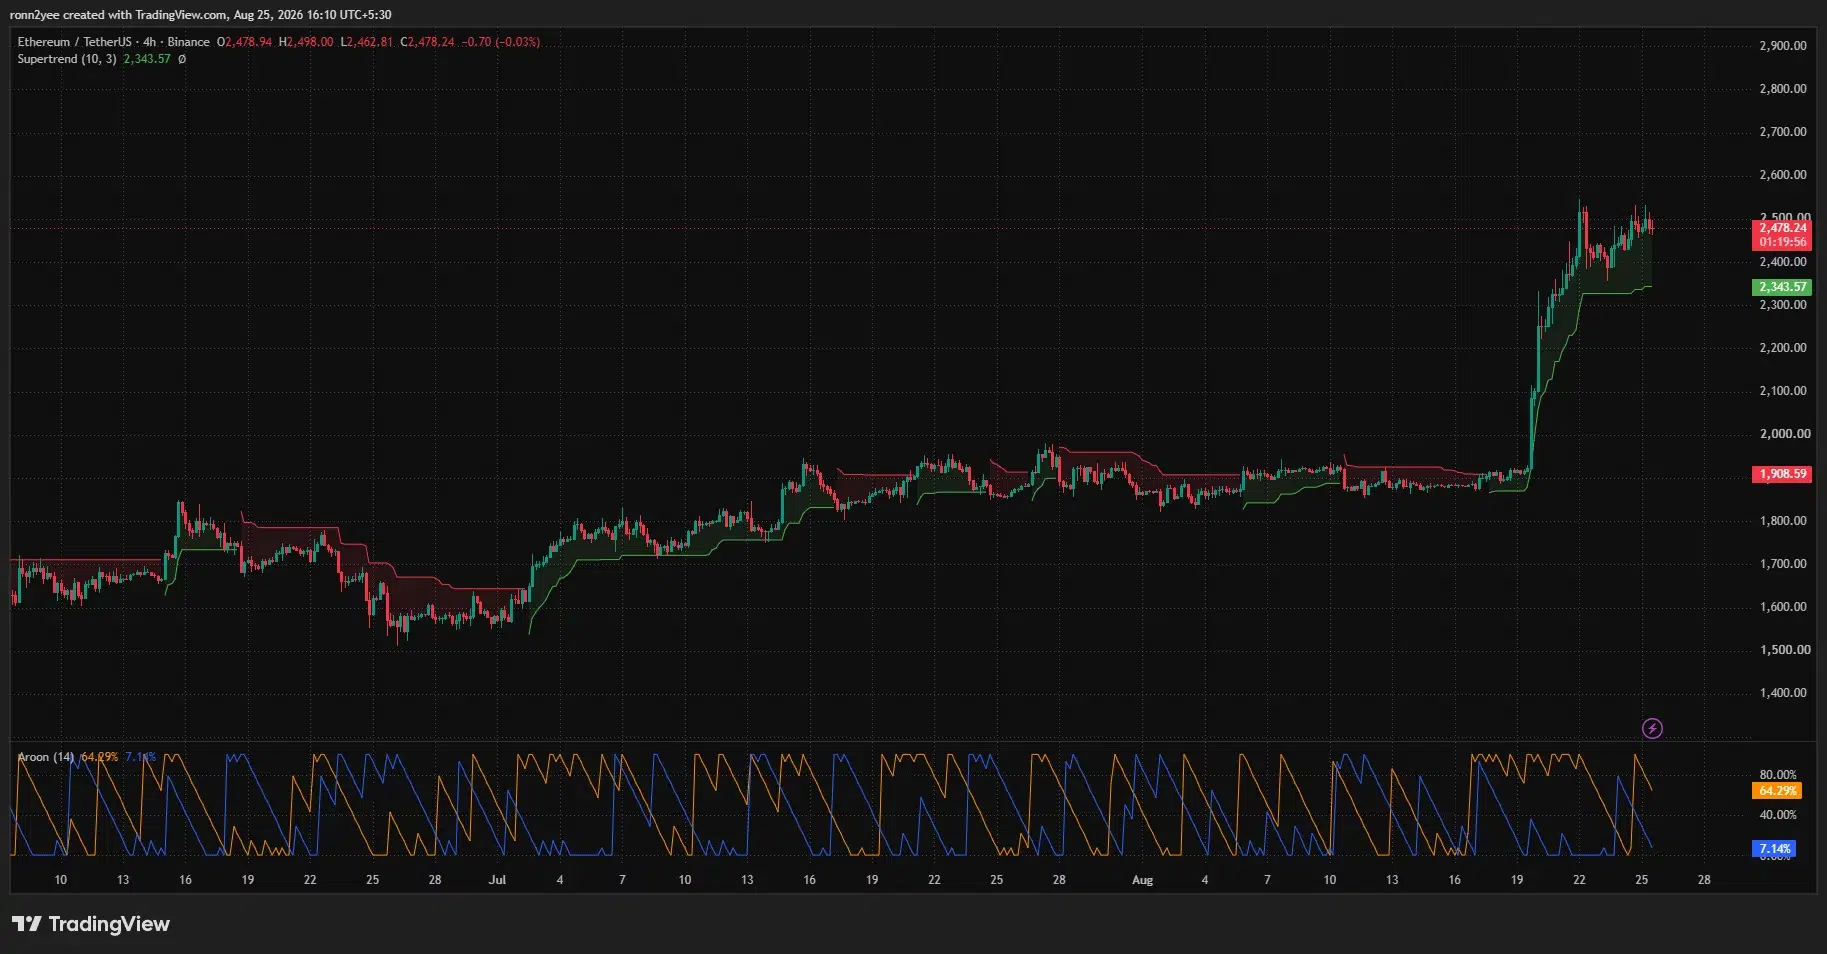
The 4-hour chart remains constructive. Ethereum is holding above its Supertrend support at approximately $2,344, while the Aroon Up reading of 64.29% remains well above the Aroon Down value of 7.14%. The gap indicates that recent highs still have more influence than recent lows, although declining Aroon Up momentum points to some cooling.
ETH liquidation map puts $2,550 in focus
CoinGlass’s three-day liquidation heatmap shows a large concentration of leveraged positions immediately above the current market. The most visible upside liquidity sits between approximately $2,540 and $2,570, with further clusters extending toward $2,600–$2,630.
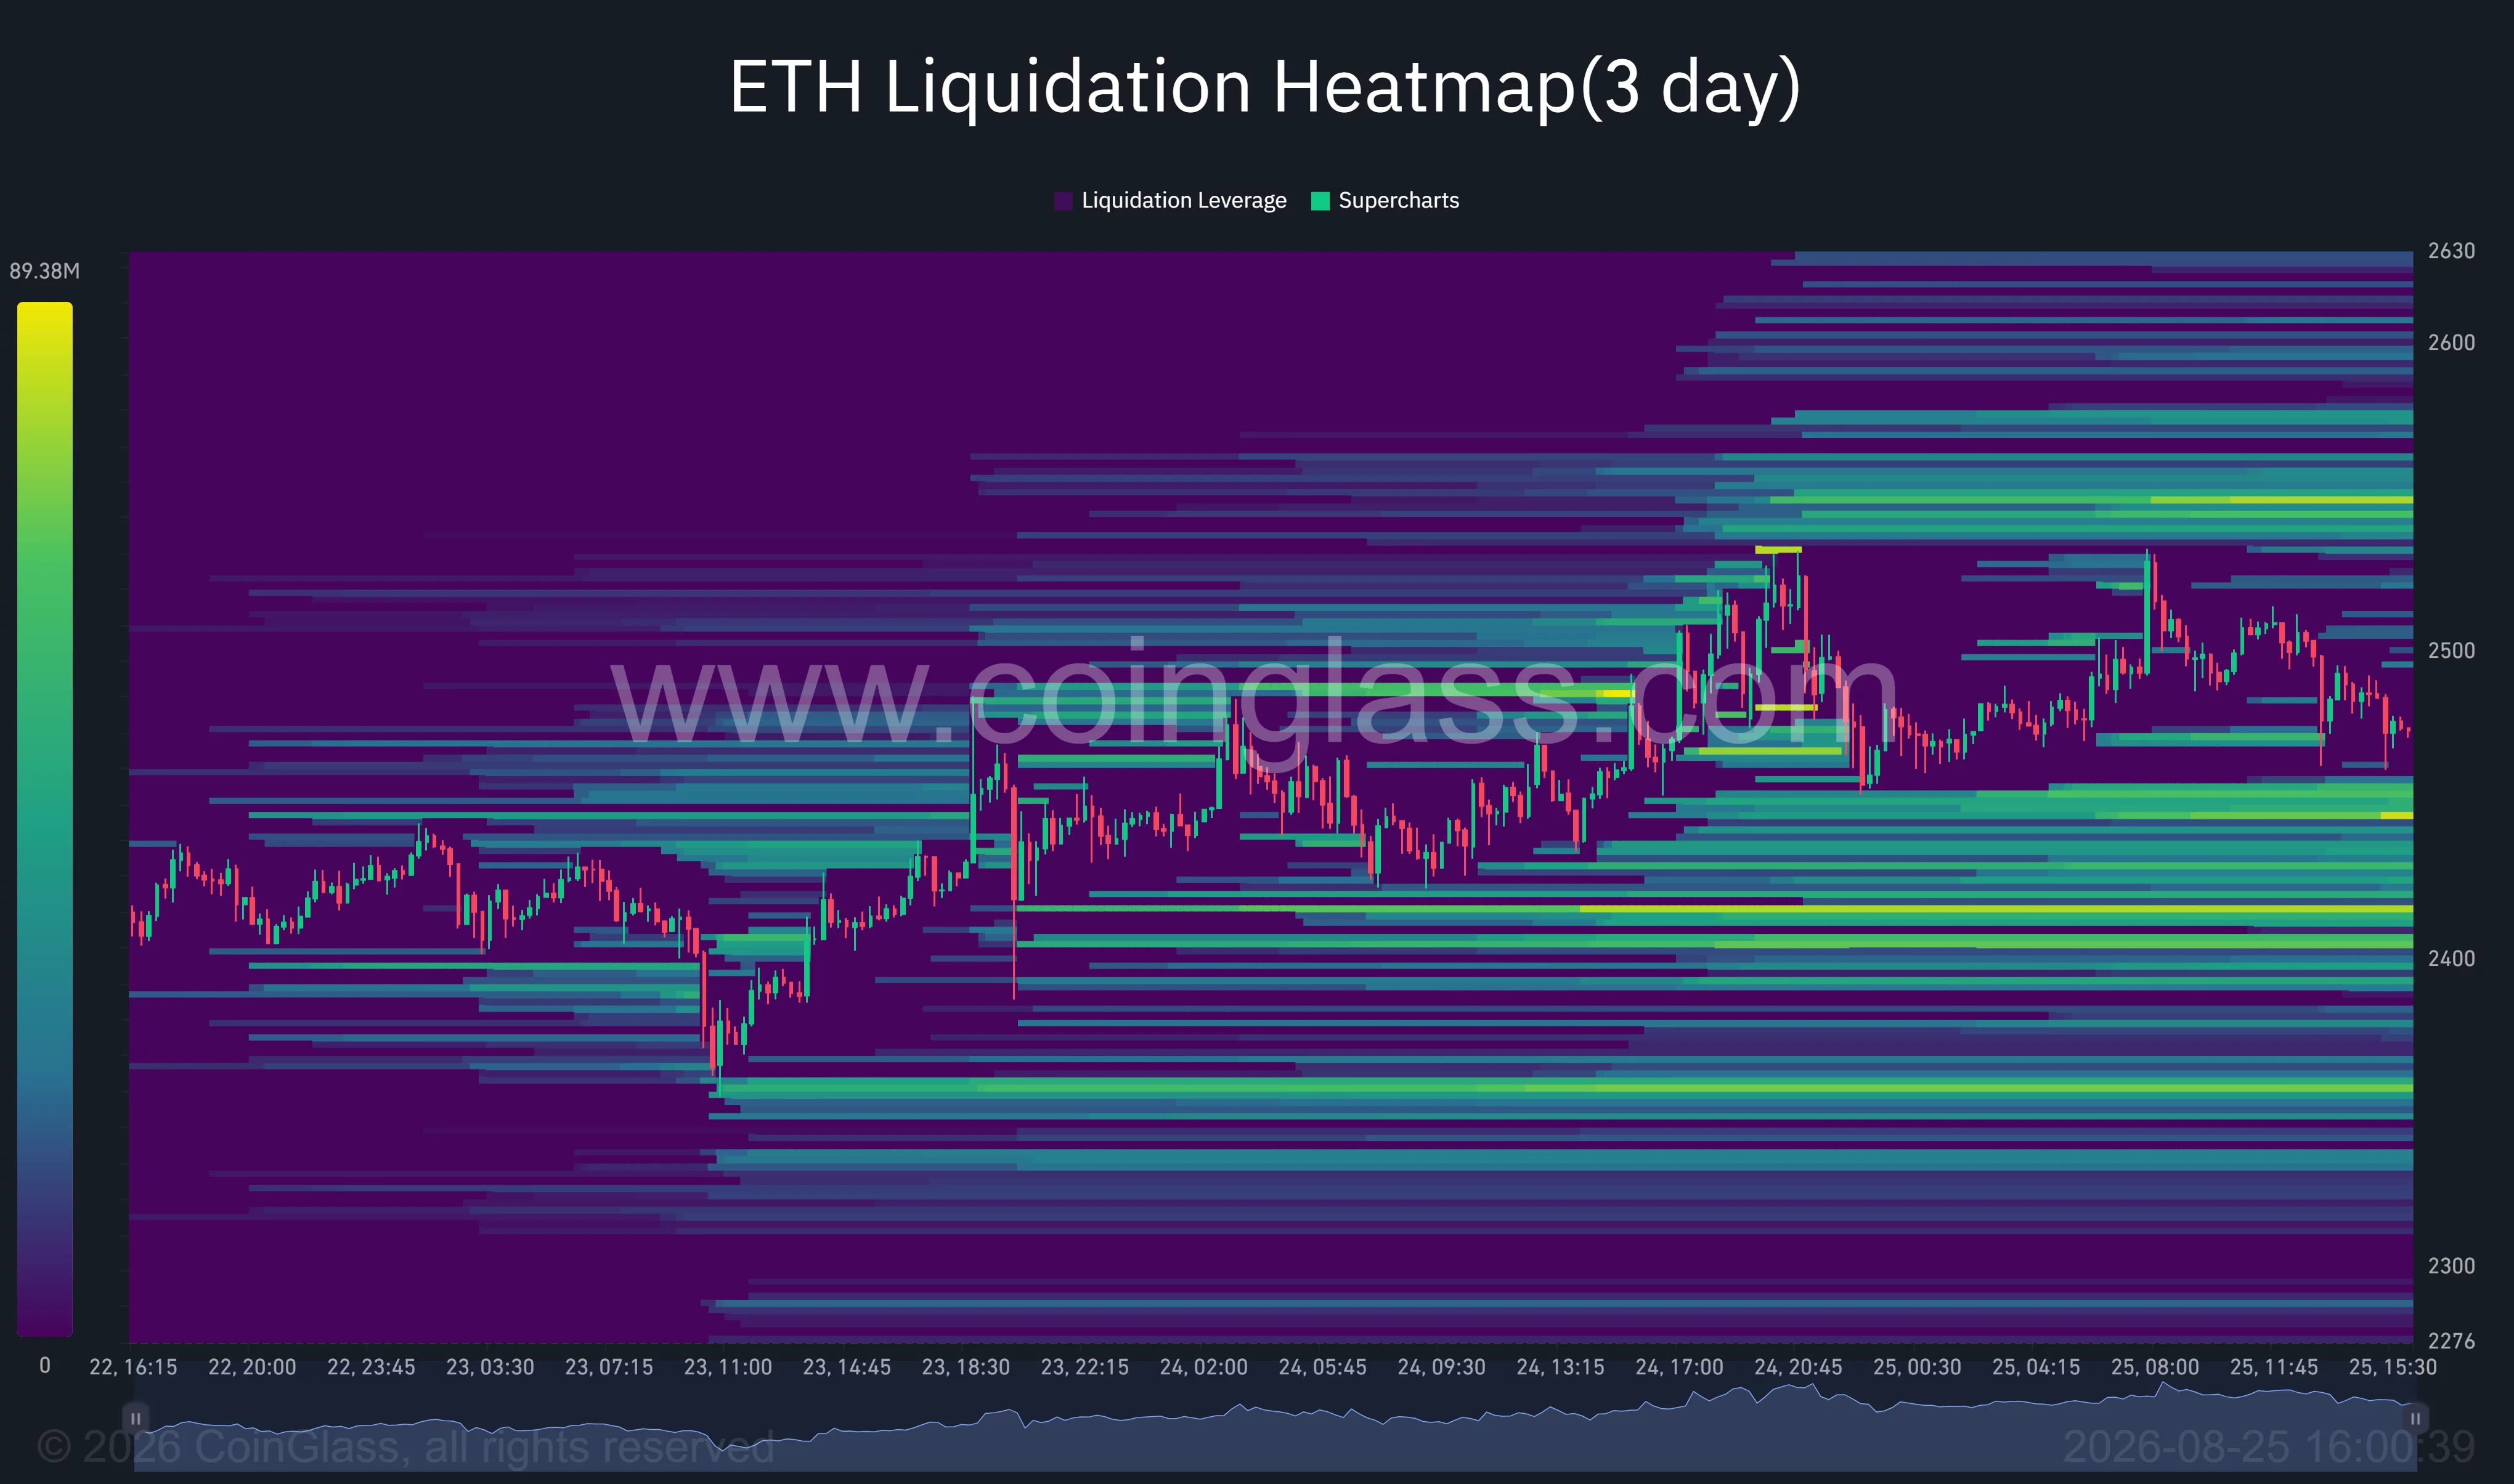
A move through $2,550 could force additional short positions to close and help ETH target $2,600. Above that range, the daily chart shows limited recent price structure until around $2,700, followed by the psychological $3,000 level.
Crypto analyst Ted Pillows identified $2,500–$2,550 as the main resistance zone. He said a weekly close above that area could support a direct move toward $3,000, though the target remains conditional on ETH confirming the breakout.
The heatmap also shows substantial downside liquidity between $2,410 and $2,450. A rejection from $2,500 could draw the price toward that zone before buyers attempt another move higher.
Below it, the 4-hour Supertrend level at $2,344 forms the next important support. Losing that level would weaken the immediate bullish structure and expose approximately $2,200, followed by the cluster of daily moving averages around $2,000–$2,080.
Michaël van de Poppe said ETH was approaching a higher-time-frame support level against Bitcoin and could benefit once Bitcoin begins consolidating. His view presents ETH’s relative performance as another possible source of upside, but the dollar chart must still clear $2,550 to confirm continuation.
Ethereum therefore enters the next weekly close between a clear breakout level and an overextended momentum reading. Holding $2,410–$2,450 would preserve the short-term setup, while a confirmed close above $2,550 would strengthen the case for $2,700 and eventually $3,000.
Disclosure: This article does not represent investment advice. The content and materials featured on this page are for educational purposes only.
