


Bitcoin price recovered toward $83,200 on Oct. 13, but weak daily momentum and another rejection near $84,000 left buyers facing a fresh test despite an analyst’s report of renewed whale activity.
Summary
- Bitcoin price traded near $83,200 after rebounding from a daily low of roughly $81,034.
- The daily MACD remained below its signal line, with a negative histogram reading.
- Analyst Ella identified $84,000 as the recovery threshold and $82,300 as nearby support.
- CoinGlass showed a strong overhead liquidation cluster around $84,600–$84,800, above Bitcoin’s latest trading price.
TradingView’s Binance BTC/USDT daily chart showed Bitcoin at $83,200.43, up 1.65% from the day’s opening price of $81,850.01. The session reached $84,168 before retreating, leaving BTC roughly $968 below its intraday high.
The rebound followed a decline to $81,033.66, putting Bitcoin about 2.7% above the session low. However, the daily chart still placed the price below its 20-day moving average, while the 4-hour chart showed momentum close to neutral.
Bitcoin’s rebound stalls below its 20-day average
TradingView’s daily Bollinger Bands placed the middle band, representing the 20-day simple moving average, at $83,986.24. Bitcoin traded approximately 0.9% below that level, making the average an immediate technical hurdle alongside the round $84,000 threshold.
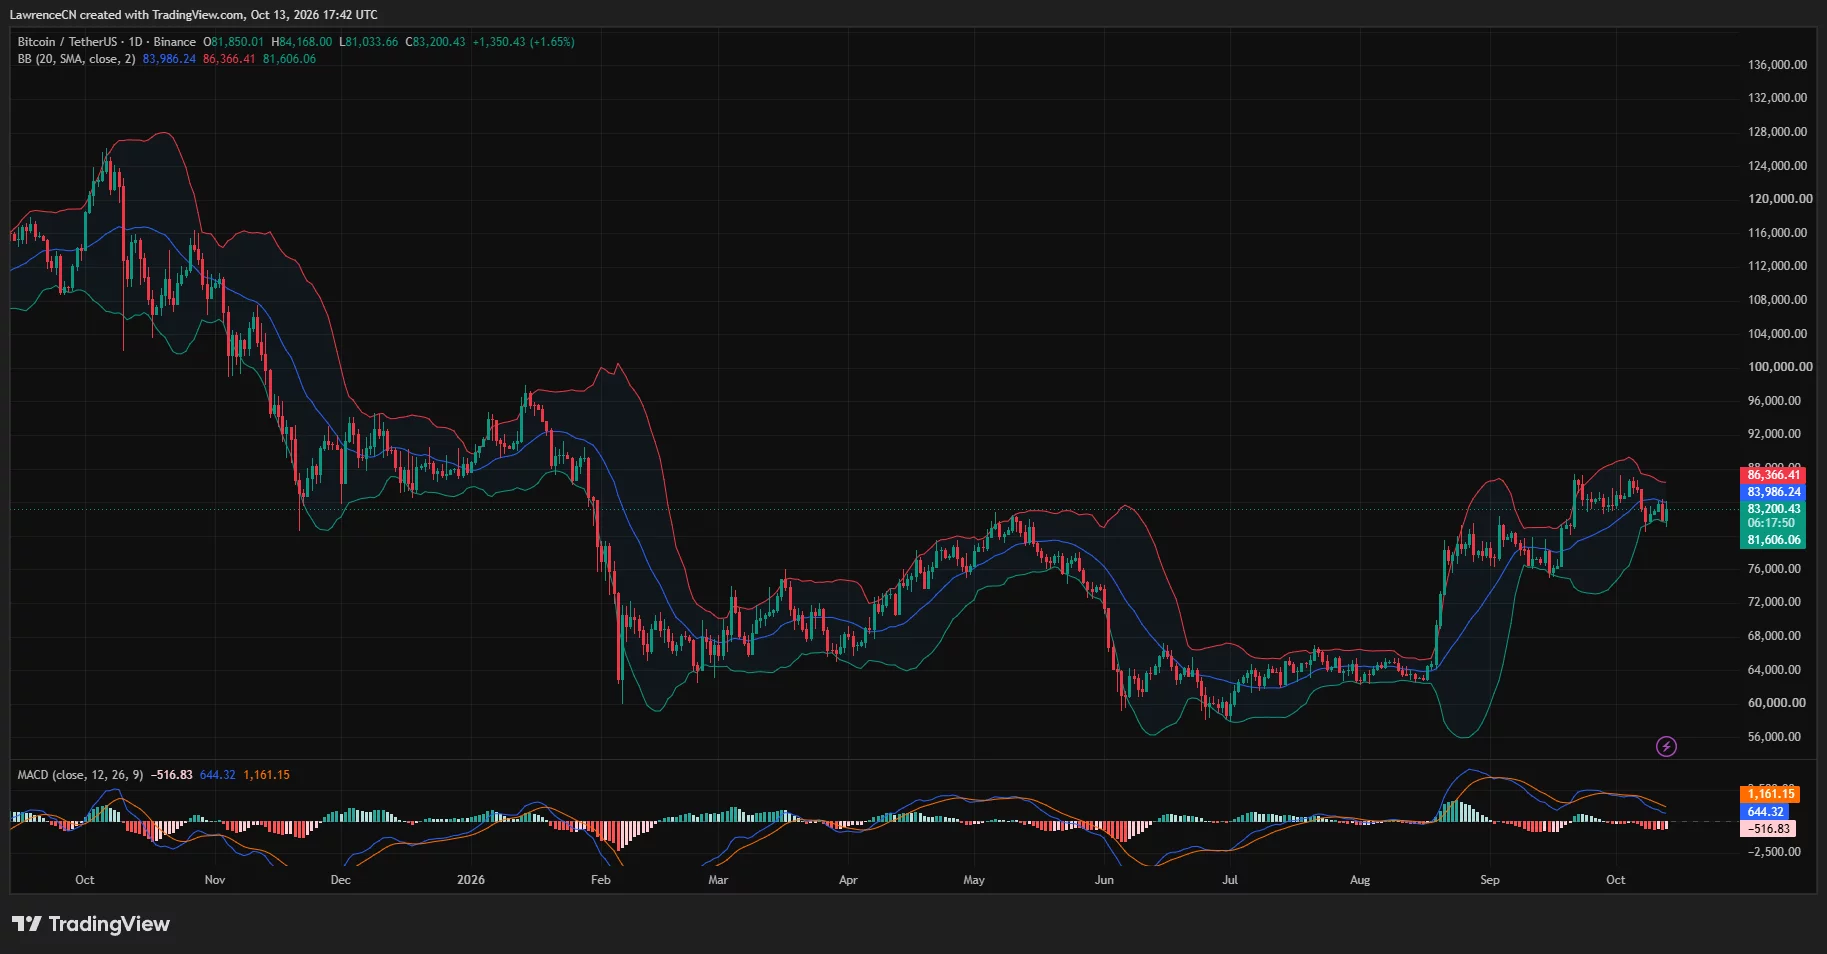
The same indicator placed the upper band at $86,366.41 and the lower band at $81,606.06. The session’s low extended below the lower band before the price recovered inside it, while the advance above the middle band failed to hold.
That sequence left the daily chart showing a recovery from the lower edge of its recent trading range rather than a sustained move into the upper half. At the latest reading, Bitcoin remained closer to the lower band than the upper one.
Daily momentum also lagged the price rebound. TradingView showed the MACD line at 644.32, below the signal line at 1,161.15, with the histogram at negative 516.83.
Although both MACD lines remained above zero, their bearish alignment persisted. The chart therefore showed positive underlying readings alongside weaker recent momentum, with the latest bounce yet to produce a bullish crossover.
The daily price history also showed that Bitcoin remained below the September and early-October peaks near $87,000. Its recovery toward $83,200 had regained part of the latest decline without overcoming those earlier highs.
Whale activity returns as an analyst watches $84,000
Market commentator Sweep said in an Oct. 13 post that large holders were again dominating Bitcoin spot trading volume. Citing a CryptoQuant average order-size chart, Sweep described a change from the previous three weeks, when retail traders had participated while whales remained on the sidelines.
Sweep suggested another upward move could follow the shift. The forecast was conditional, and the post focused on the size of spot market orders rather than a specific upside price target.
Analyst Ella offered a shorter-term framework after Bitcoin’s latest attempt to rise above $84,000. In a separate Oct. 13 post, Ella said buyers had appeared around $82,300 and helped lift BTC toward $82,900 after the rejection.
Ella identified a move above $84,000 as the condition that would give the price more room to recover. A break below $82,300, meanwhile, would bring $81,300 into focus.
Those levels placed the latest TradingView price between the analyst’s recovery threshold and nearby support. Bitcoin’s daily high showed that buyers had already crossed $84,000 during the session, but the retreat toward $83,200 left that advance unconfirmed.
The 4-hour chart shows a narrow momentum balance
TradingView’s 4-hour chart showed Bitcoin at $83,212.94, with the relative strength index at 49.50. The RSI stood slightly below its moving average of 50.97 and just beneath the neutral 50 threshold.
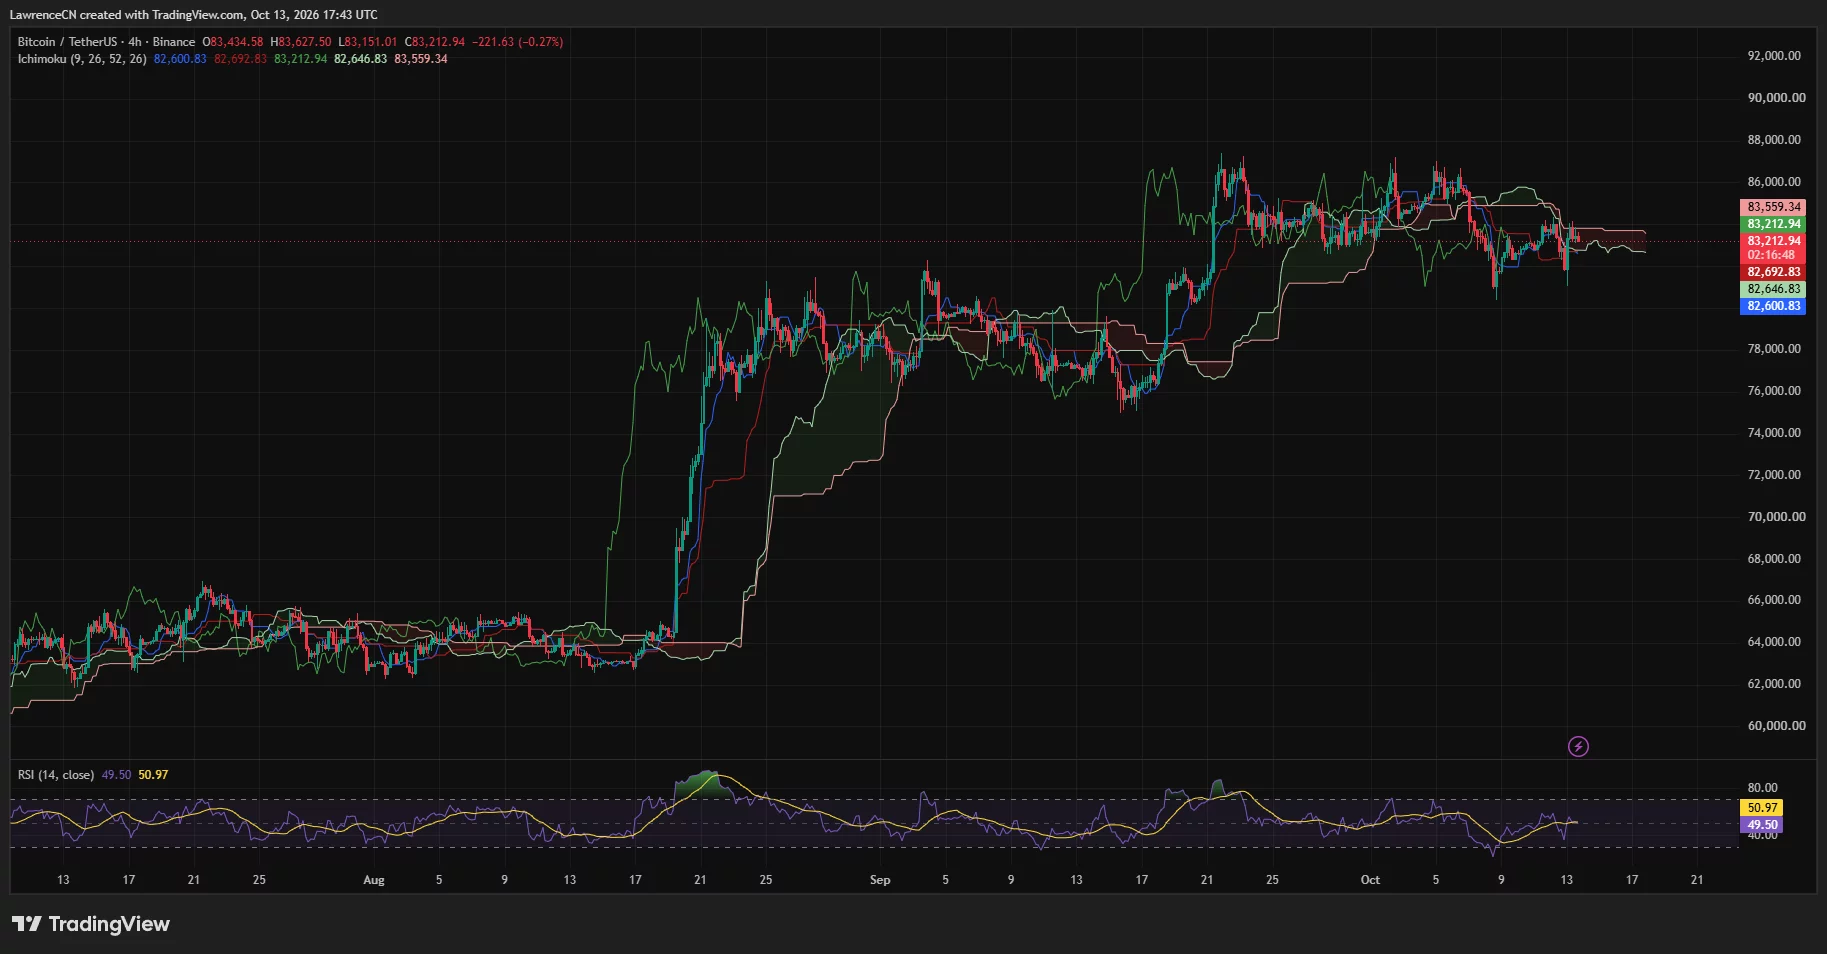
The Ichimoku conversion line stood at $82,600.83, while the base line was $82,692.83. Bitcoin traded above both readings, although the conversion line remained below the base line.
The cloud boundaries displayed at $82,646.83 and $83,559.34 placed the latest price inside the cloud. That left the 4-hour chart showing a rebound above its shorter-term reference lines while price remained beneath the cloud’s upper boundary.
The upper boundary was roughly $346 above BTC’s latest reading and below Ella’s $84,000 threshold. On the chart, those two levels formed successive obstacles before the higher daily Bollinger Band near $86,366.
Below the market, the Ichimoku readings clustered around $82,600–$82,700, followed by Ella’s $82,300 support. The daily lower Bollinger Band near $81,606 sat farther down, above the analyst’s $81,300 downside level.
Liquidation clusters build above the recovery
CoinGlass’s three-day Bitcoin liquidation heatmap showed its brightest nearby overhead band around $84,600–$84,800. Another concentration appeared near $84,300, with additional bands extending toward $85,500.
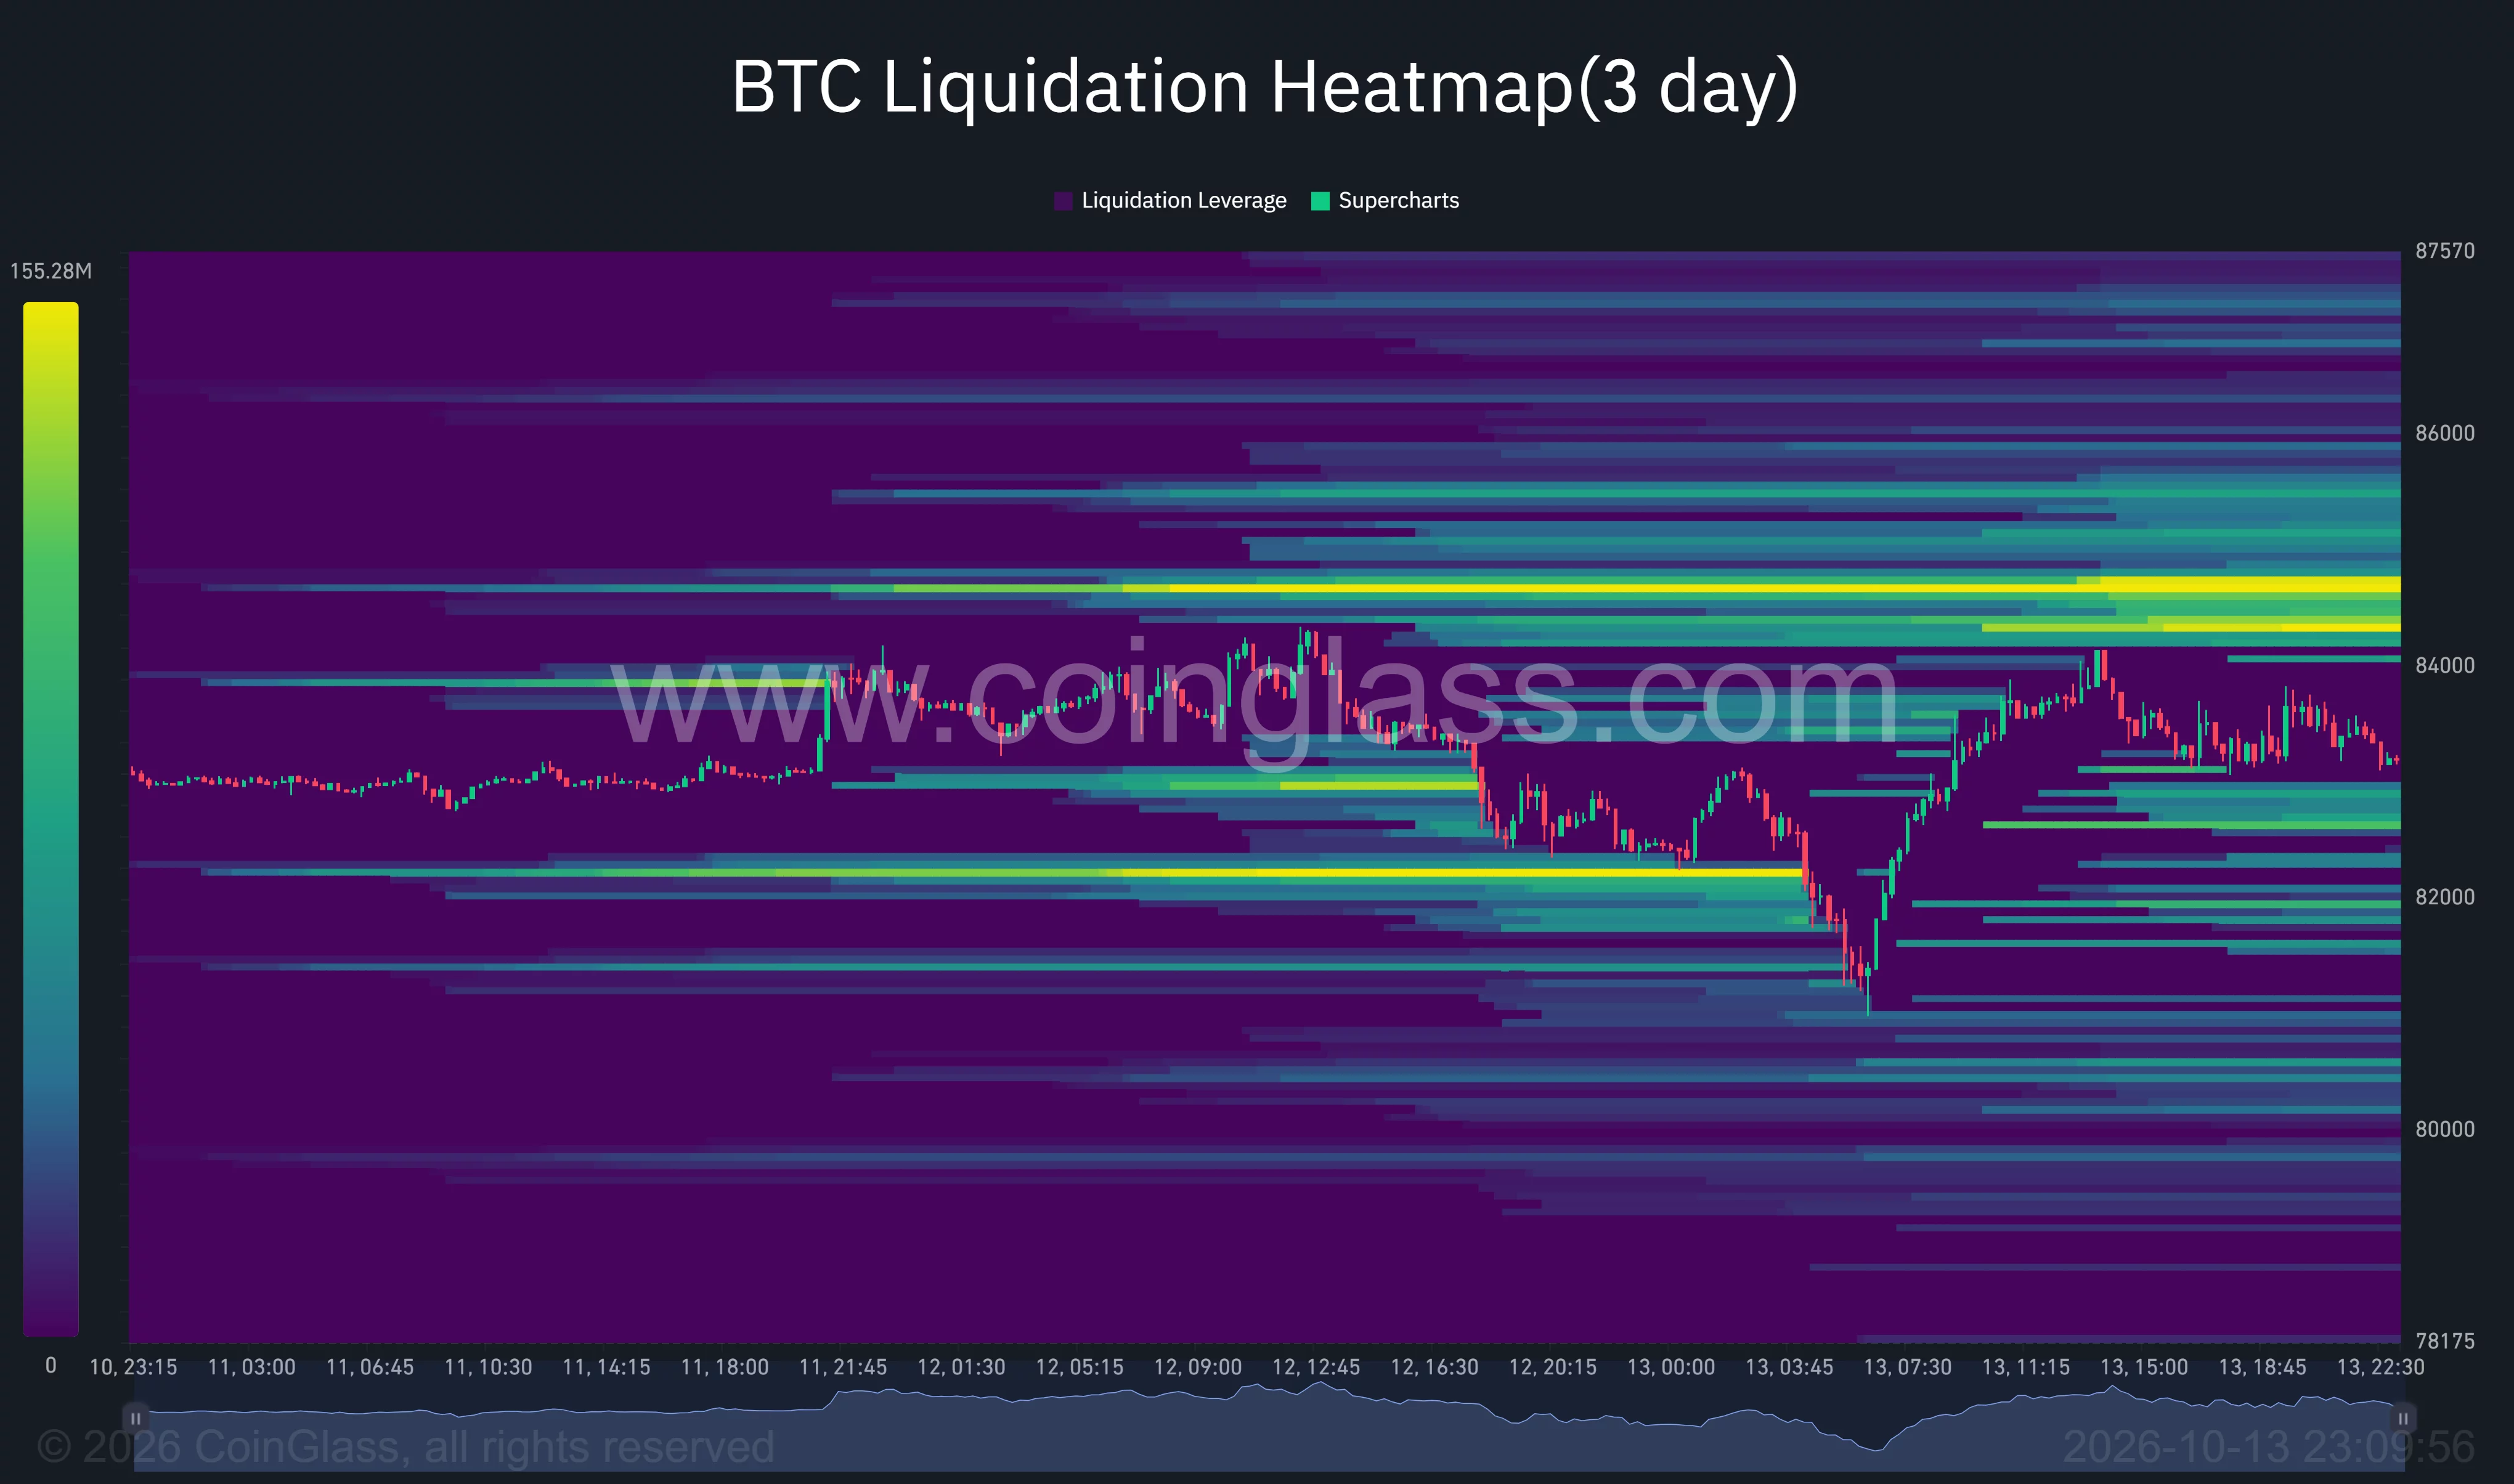
Below the latest price, the heatmap showed concentrations around $82,600–$82,800 and $81,600–$82,000. Earlier in the three-day window, a bright band near $82,200 preceded the sharp decline toward $81,000 and subsequent recovery.
The overhead clusters sat beyond the $84,000 level watched by Ella, while several lower clusters overlapped the support region visible on TradingView.
For the immediate price outlook, Ella’s framework remained specific: reclaiming $84,000 would support a further recovery attempt, while losing $82,300 would shift attention toward $81,300.
Disclosure: This article does not represent investment advice. The content and materials featured on this page are for educational purposes only.
