


Bitcoin has lost roughly 14% over the past week to trade near $64,600 on Nov. 16, with experts pointing to a weekend leverage flush and persistent ETF withdrawals as traders assess whether the selloff has run its course.
Summary
- Bitcoin has recovered from its weekend low near $62,000 but remains below major daily moving averages.
- Hilbert Group’s Jesse Marre attributes the weekend collapse primarily to leveraged positions unwinding during thin trading.
- US spot Bitcoin ETFs lost $1.065 billion last week, extending their withdrawal streak to seven sessions.
- Analysts identify $63,900 and $65,400 as immediate levels separating another decline from a potential rebound.
Hilbert Group senior portfolio manager Jesse Marre, in comments sent to crypto.news, described a market that declined steadily before selling accelerated during the weekend’s quieter trading hours. BTSE chief operating officer Jeff Mei pointed to continued ETF withdrawals and uncertainty around interest rates as reasons buyers remain hesitant.
Bitcoin’s weekend plunge points to a leverage flush
Marre said Bitcoin’s earlier daily losses of 1% to 2% gave way to a 12% weekend drop, with much of the selling occurring when trading liquidity was thin. The retreat toward $62,000 erased the rally that began in August, according to his assessment.
“What the market did see was a collapse in open interest, which means capitulation in the perpetual market and is a much more likely explanation,” he said.
Open interest measures outstanding derivatives contracts. Marre interpreted its decline as evidence that leveraged positions were being closed, arguing that large traditional investors were unlikely to execute substantial sales during illiquid weekend hours.
Earlier coverage of the weekend liquidation wave cited CoinGlass figures showing $1.96 billion in cryptocurrency positions liquidated over a rolling 24-hour period. Bitcoin accounted for roughly $750 million, with long positions representing nearly 80%.
Marre was unconvinced by explanations linking the decline to capital leaving ahead of Anthropic’s IPO, fallout from the Binance hack or sudden concerns about cryptographic security. He described the latter as “a narrative to fit the price action.”
ETF withdrawals leave buyers watching US demand
Data from Farside Investors show Bitcoin ETFs lost $1.065 billion during Nov. 9–13. Withdrawals occurred in all five sessions, led by Wednesday’s $299.8 million, followed by $284.1 million Thursday and $185.4 million Friday.
Across the five trading sessions, BlackRock’s IBIT lost $908.4 million, while Fidelity’s FBTC shed $111.3 million. Morgan Stanley’s MSBT attracted $54.4 million, partially offsetting withdrawals elsewhere.
“Investors are hesitant to buy the dip, given that rate hike odds are high and the outlook for AI and tech stocks remains uncertain,” Mei told crypto.news.
He identified Monday’s ETF demand and Federal Reserve Chair Kevin Warsh’s speech as developments he was watching for changes in liquidity expectations. Monday’s flow figures were not yet available in Farside’s table at the reporting snapshot.
Marre said hotter-than-expected inflation had pushed December rate-hike pricing from roughly 65% to 90%. He cited headline monthly inflation of 0.4%, against 0.3% expected, and core inflation of 0.3%, against a 0.2% forecast.
Bitcoin’s daily chart keeps recovery hurdles overhead
The Binance daily chart places Bitcoin near $64,584, below its 200-day moving average at $72,920 and its 20-day average at $74,355. The 100-day and 50-day averages sit higher, near $77,788 and $79,446.
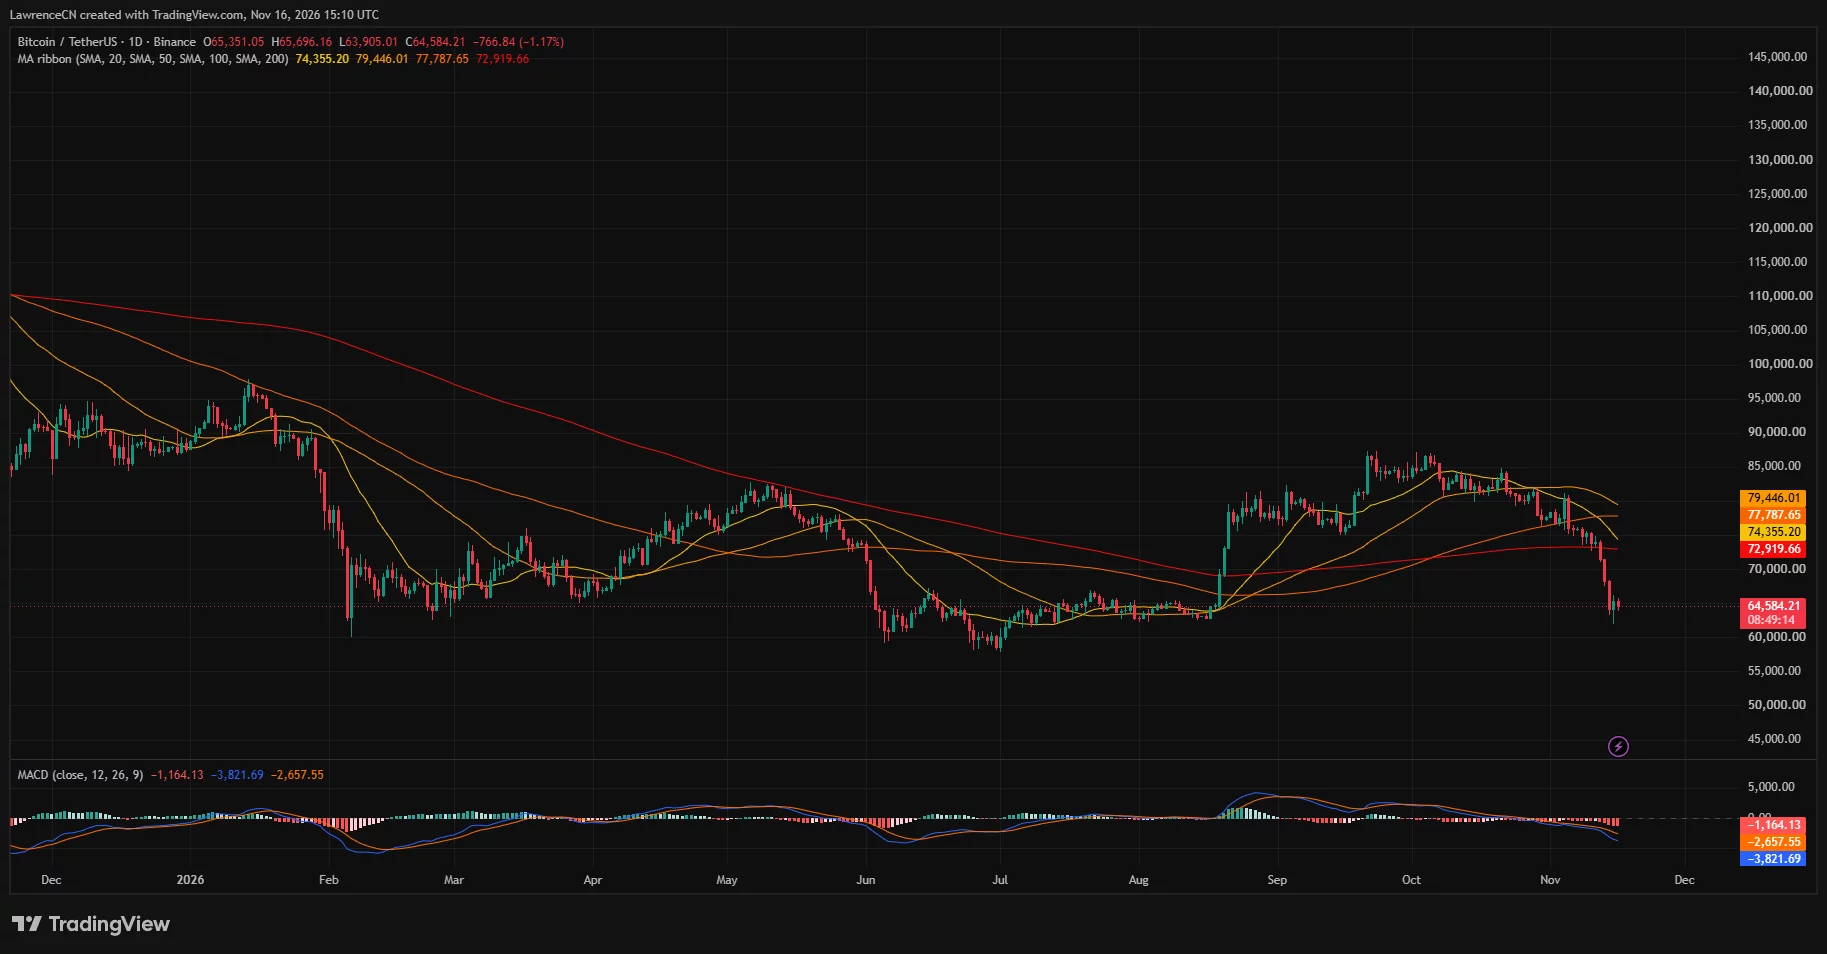
Daily MACD remains below its signal line and zero, with a negative histogram. On the weekly chart, Bitcoin trades below the Bollinger Band midpoint around $73,960, while the lower band stands near $57,491.
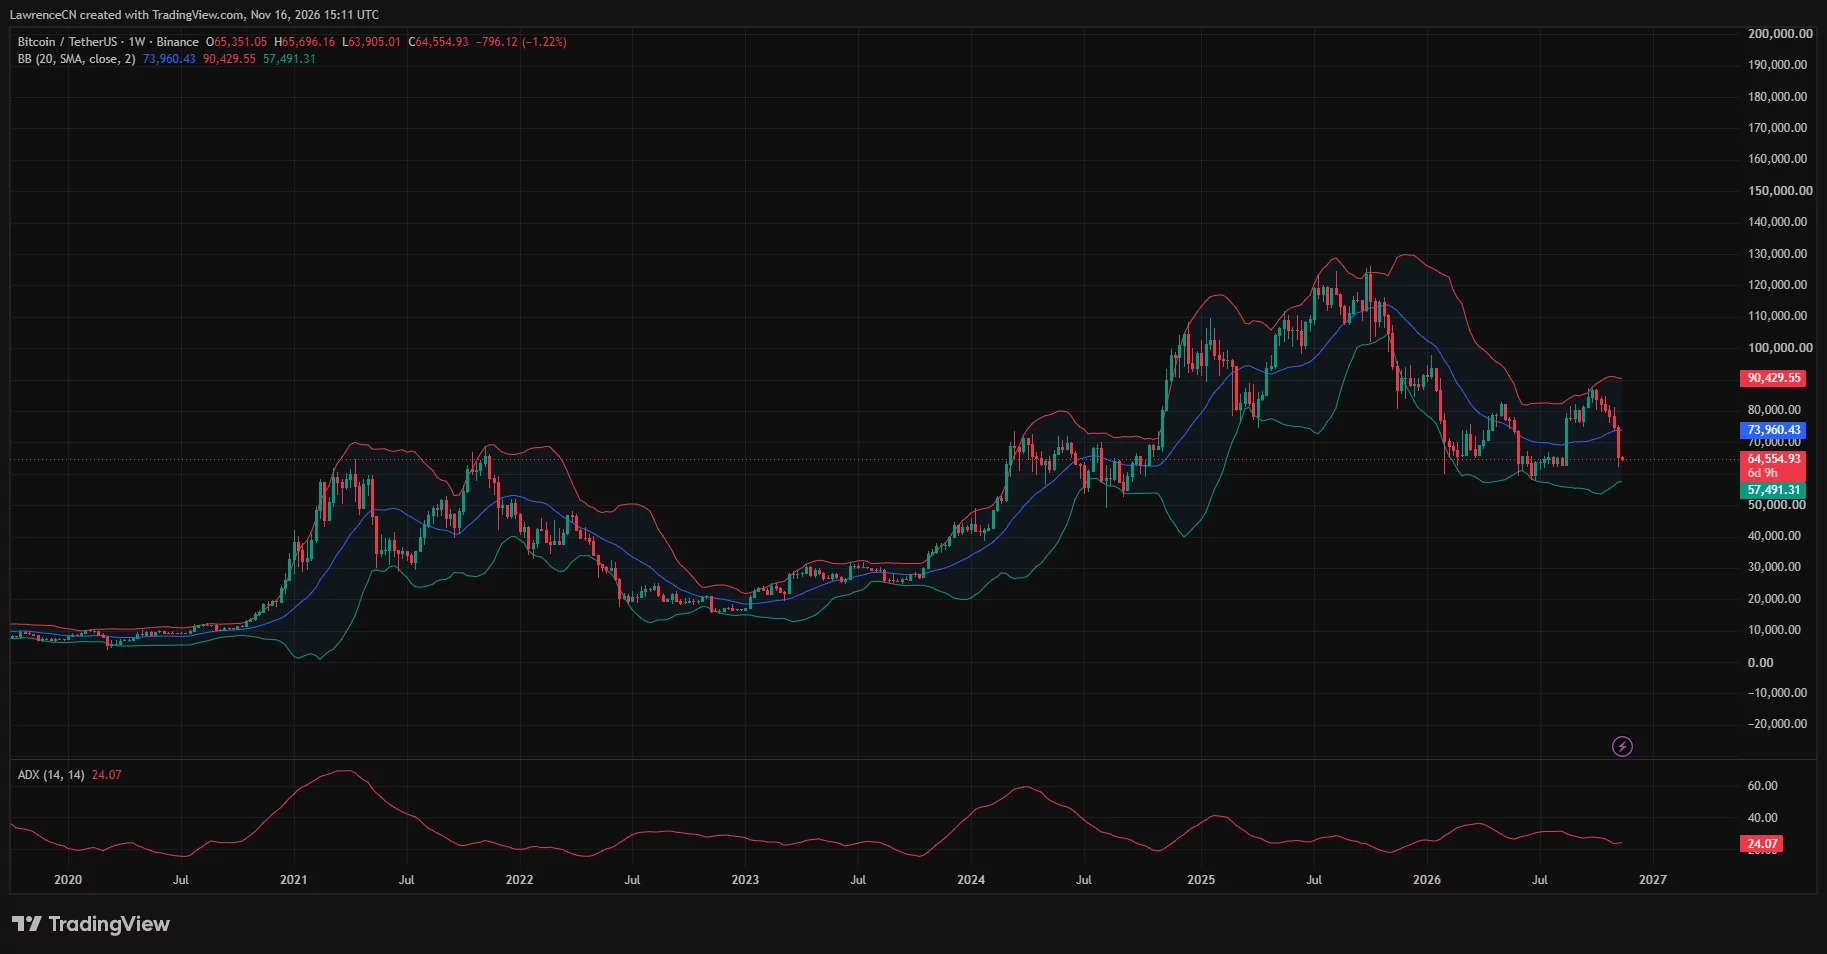
CryptoBullet, in the Nov. 16 post, described daily RSI as deeply oversold and suggested Bitcoin could consolidate for one or two months. He identified the 200-day moving average as a key level.
A separate market recovery assessment cited KuCoin identifying $62,000–$63,000 as immediate support and $67,000–$70,000 as a recovery zone Bitcoin would need to reclaim.
Traders map $63,900 and $65,400 as immediate triggers
Merlijn The Trader outlined two conditional scenarios in his post: a break above $65,400 would put $68,000 in focus, while losing $63,900 would point toward $61,000.
The CoinGlass heatmap shows nearby estimated liquidation concentrations around $63,500–$64,000 below price and $65,500–$66,000 above it, with further overhead bands toward $68,000–$69,000.
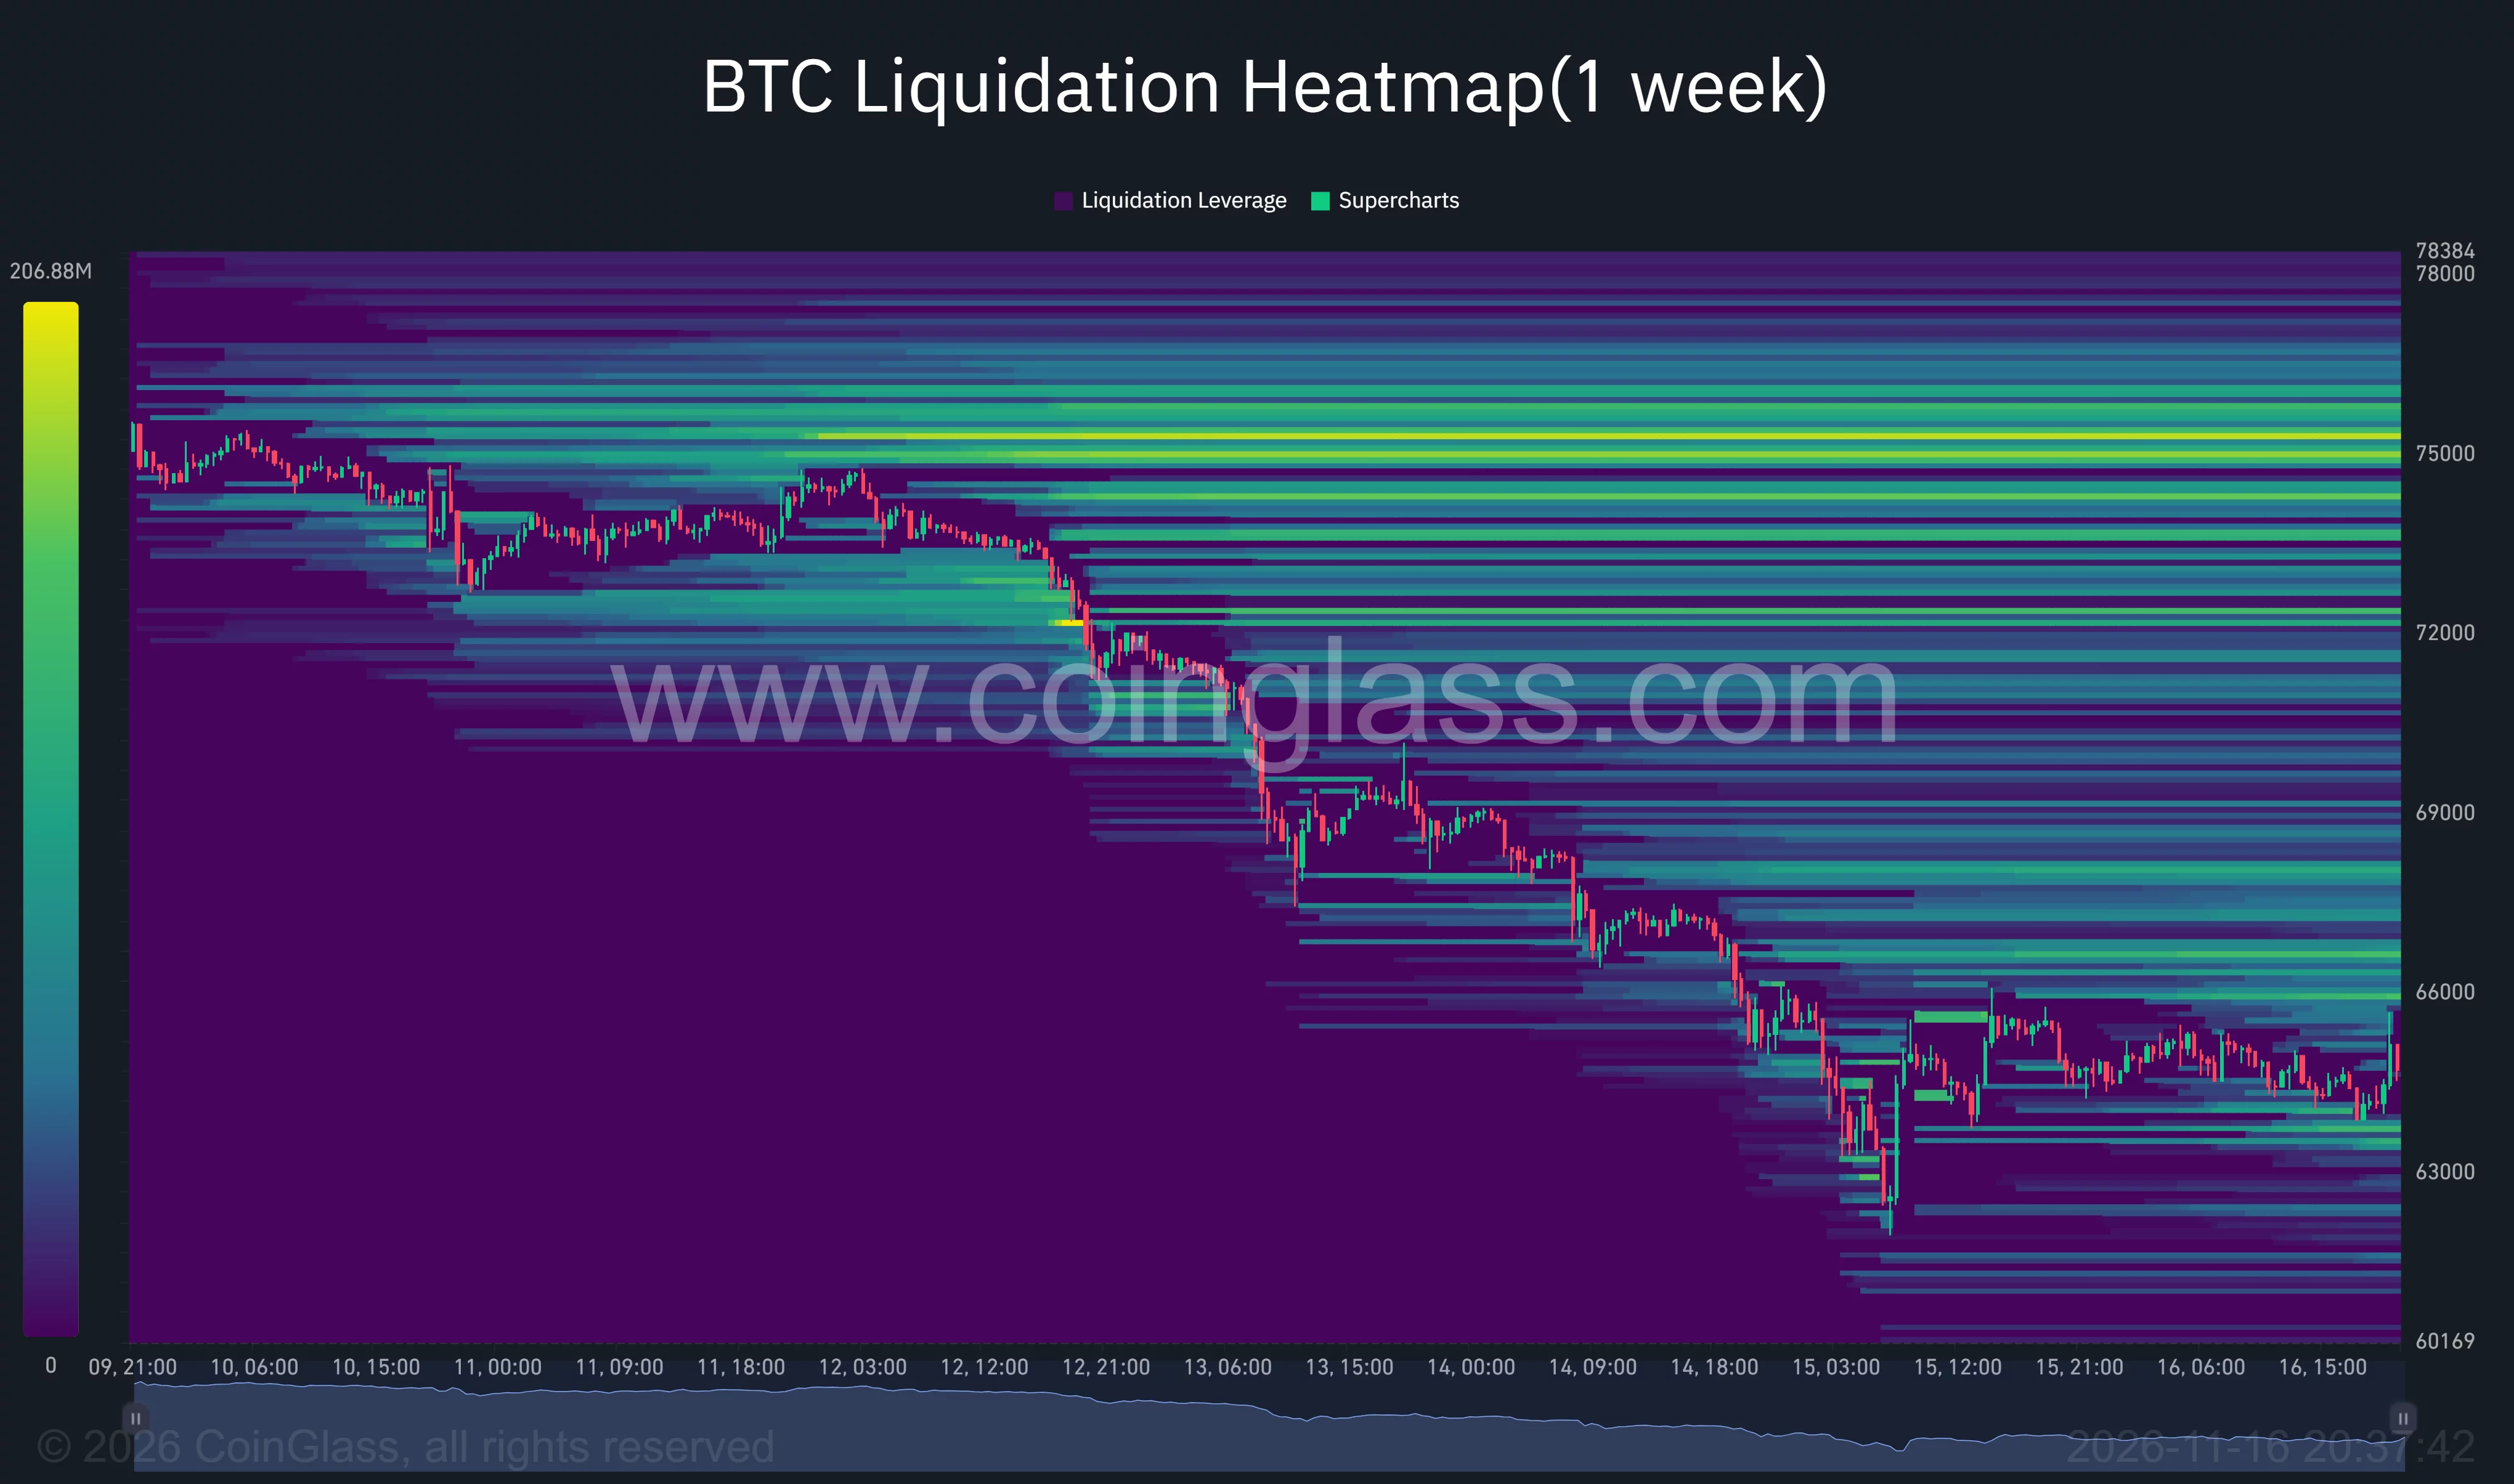
Marre said options positioning remained defensive after implied volatility eased from its spike. His figures put one-week realized volatility at 59%, compared with implied volatility of 47%, and 10-delta skew at 17 points in favor of puts.
Disclosure: This article does not represent investment advice. The content and materials featured on this page are for educational purposes only.
