


Bitcoin price rebounded above $64,000 as Qatar reported progress in efforts to restart US-Iran negotiations, while technical charts pointed to a possible breakout from a descending channel.
Summary
- Bitcoin price recovered from $62,400 to above $64,000 as geopolitical concerns eased.
- A 4-hour close above $64,300 could open a move toward $65,500 and $66,500.
- Sell orders between $64,000 and $65,000 remain an immediate obstacle for buyers.
- Liquidation liquidity is concentrated near $62,000, raising the risk of another downside sweep.
Bitcoin price rebounds above $64,000
According to data from crypto.news, Bitcoin (BTC) price traded near $64,100 late Tuesday, recovering from an intraday low around $63,300 and extending its rebound from the $62,400-$62,500 support area.
The daily chart showed BTC closing above the 61.8% Fibonacci retracement level at $63,496. Holding this threshold would keep the recovery structure intact and allow buyers to target the 78.6% retracement at $65,026.
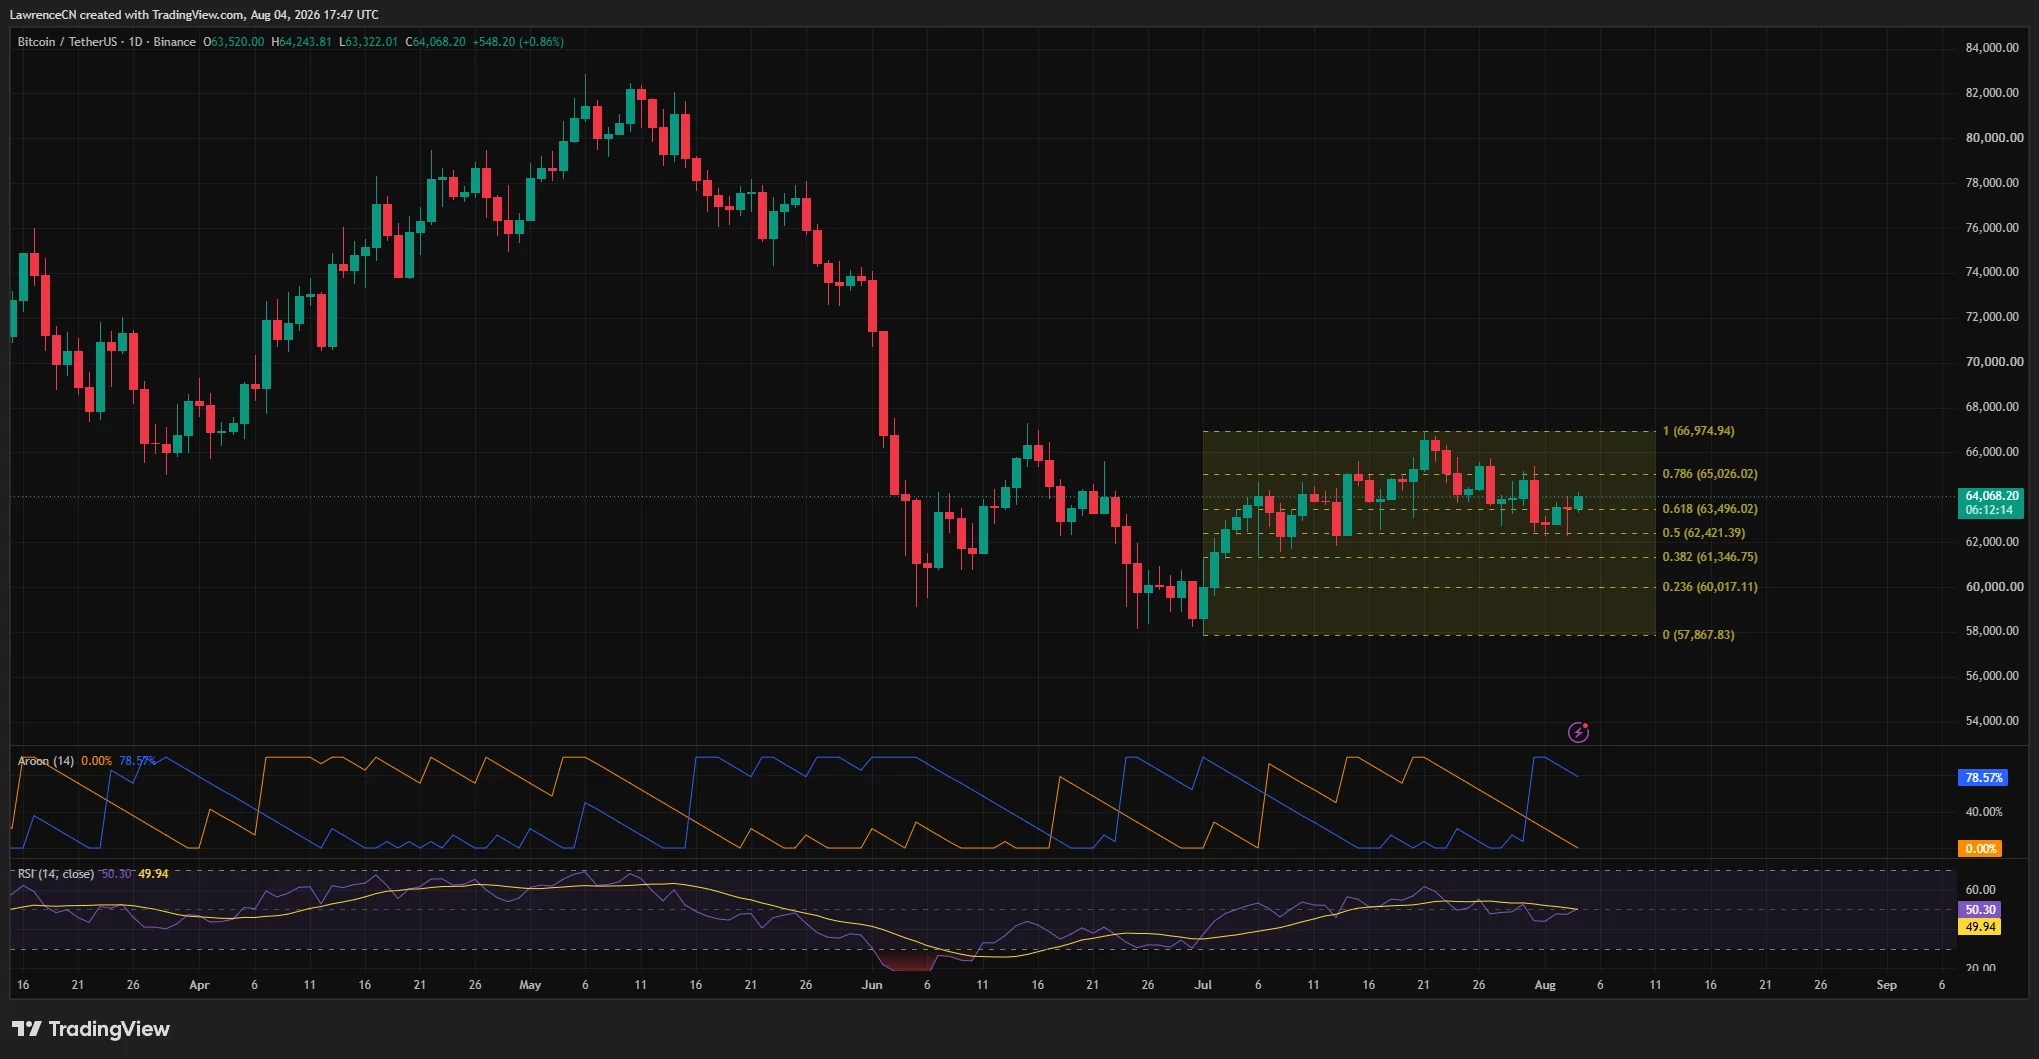
Momentum has also improved. The daily Relative Strength Index stood at 50.30, moving slightly above its signal line at 49.94. The reading places Bitcoin in neutral territory and suggests neither buyers nor sellers have full control.
The Aroon indicator offered a more positive signal. Aroon Up stood at 78.57%, while Aroon Down fell to zero, showing that recent highs are becoming more relevant than recent lows.
However, Bitcoin remains inside a broader consolidation range between approximately $57,868 and $66,975. A daily close above $65,026 would strengthen the short-term recovery, but the July high near $66,975 remains the larger breakout level.
US-Iran talks support demand for risk assets
Bitcoin’s rebound followed Qatar’s confirmation that regional mediators were working to bring the United States and Iran back to negotiations.
Qatari Foreign Ministry spokesperson Majed Al-Ansari said Doha wanted conditions in the Strait of Hormuz to return to normal. Qatar, Pakistan, and Oman are exchanging proposals between Washington and Tehran, although no timetable has been set for an agreement.
“What matters to us now is the resumption of negotiations, and to achieve this, a ceasefire and the reopening of the Strait of Hormuz must be guaranteed,” Al-Ansari said.
The diplomatic push has eased some concerns surrounding global energy supplies. The Strait of Hormuz remains one of the world’s most important oil transit routes, meaning any reopening could reduce pressure on crude prices and improve demand for risk assets.
Still, the negotiations remain uncertain. Iran has denied holding direct talks with Washington, describing its discussions as negotiations with Oman. Shipping activity through the strait also remains restricted despite reported diplomatic progress.
For US investors, the outcome could affect Bitcoin through oil prices, inflation expectations, and broader risk sentiment. A ceasefire and restored shipping traffic could support crypto and equities, while another breakdown in talks may renew demand for cash and other defensive assets.
Bitcoin tests descending channel resistance
The 4-hour chart showed Bitcoin testing the upper boundary of a descending parallel channel that has guided price action since the July 21 peak near $66,700.
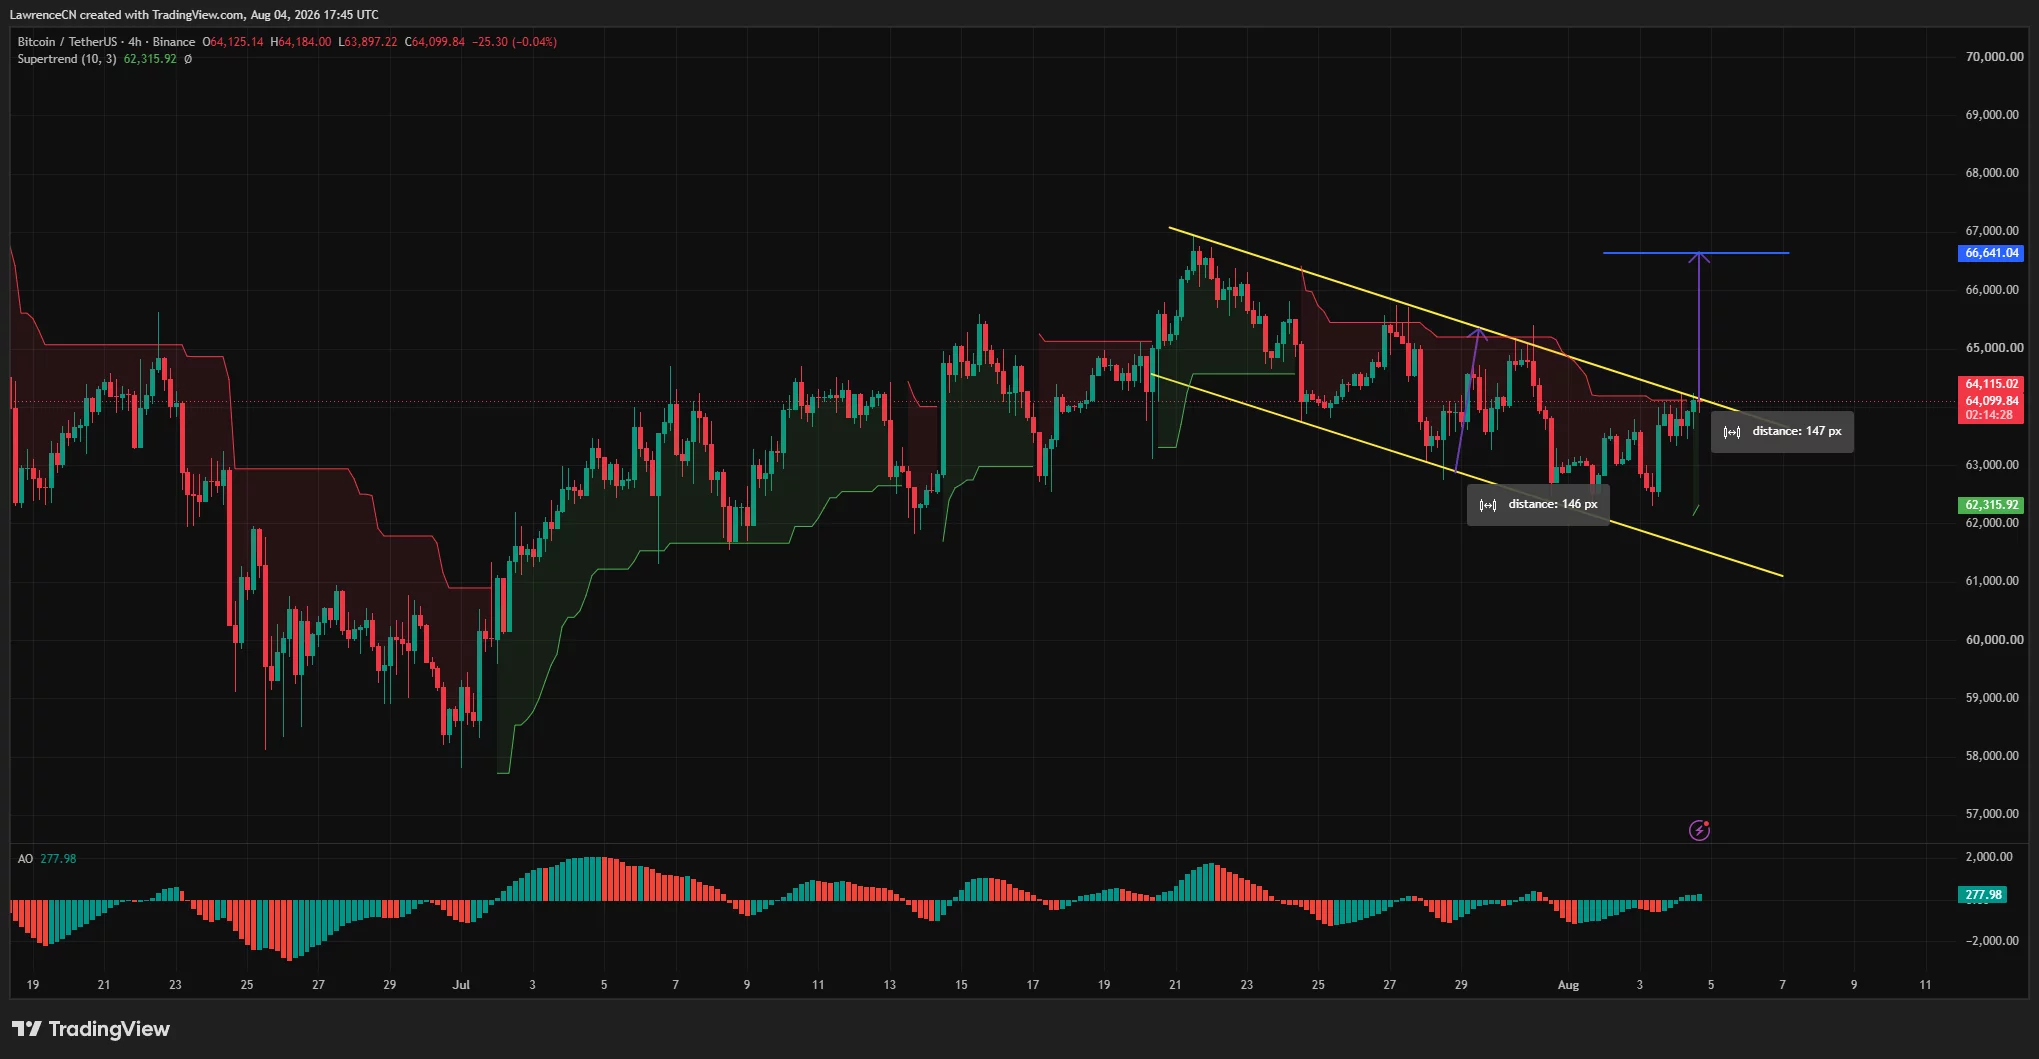
BTC briefly moved above the channel boundary before returning toward $64,100, showing that buyers have yet to confirm a breakout. The Supertrend indicator also placed immediate resistance near $64,115, almost level with the current price.
Analyst Ali Martinez identified $64,300 as the key confirmation level. According to Martinez, a 4-hour close above that price could validate the channel breakout and open the way toward $65,500 or $66,500.
The Awesome Oscillator climbed to 277.98 and printed rising green bars, indicating that bullish momentum was building on the 4-hour timeframe. However, momentum alone may not be enough if Bitcoin fails to absorb overhead supply.
Order-book data shared by analyst Ted Pillows showed large sell orders appearing between $64,000 and $65,000. This supply helps explain why BTC has repeatedly struggled to extend gains above the current range.
A confirmed break above $65,000 would place the next targets at $65,500 and $66,641. Failure to clear the channel could send the price back toward $63,500 and the 4-hour Supertrend support near $62,316.
Liquidation map keeps $62,000 in focus
The one-week Bitcoin liquidation heatmap showed a large concentration of leveraged positions near $62,000. It was the brightest liquidity band below the current price and may attract price if the recovery loses momentum.
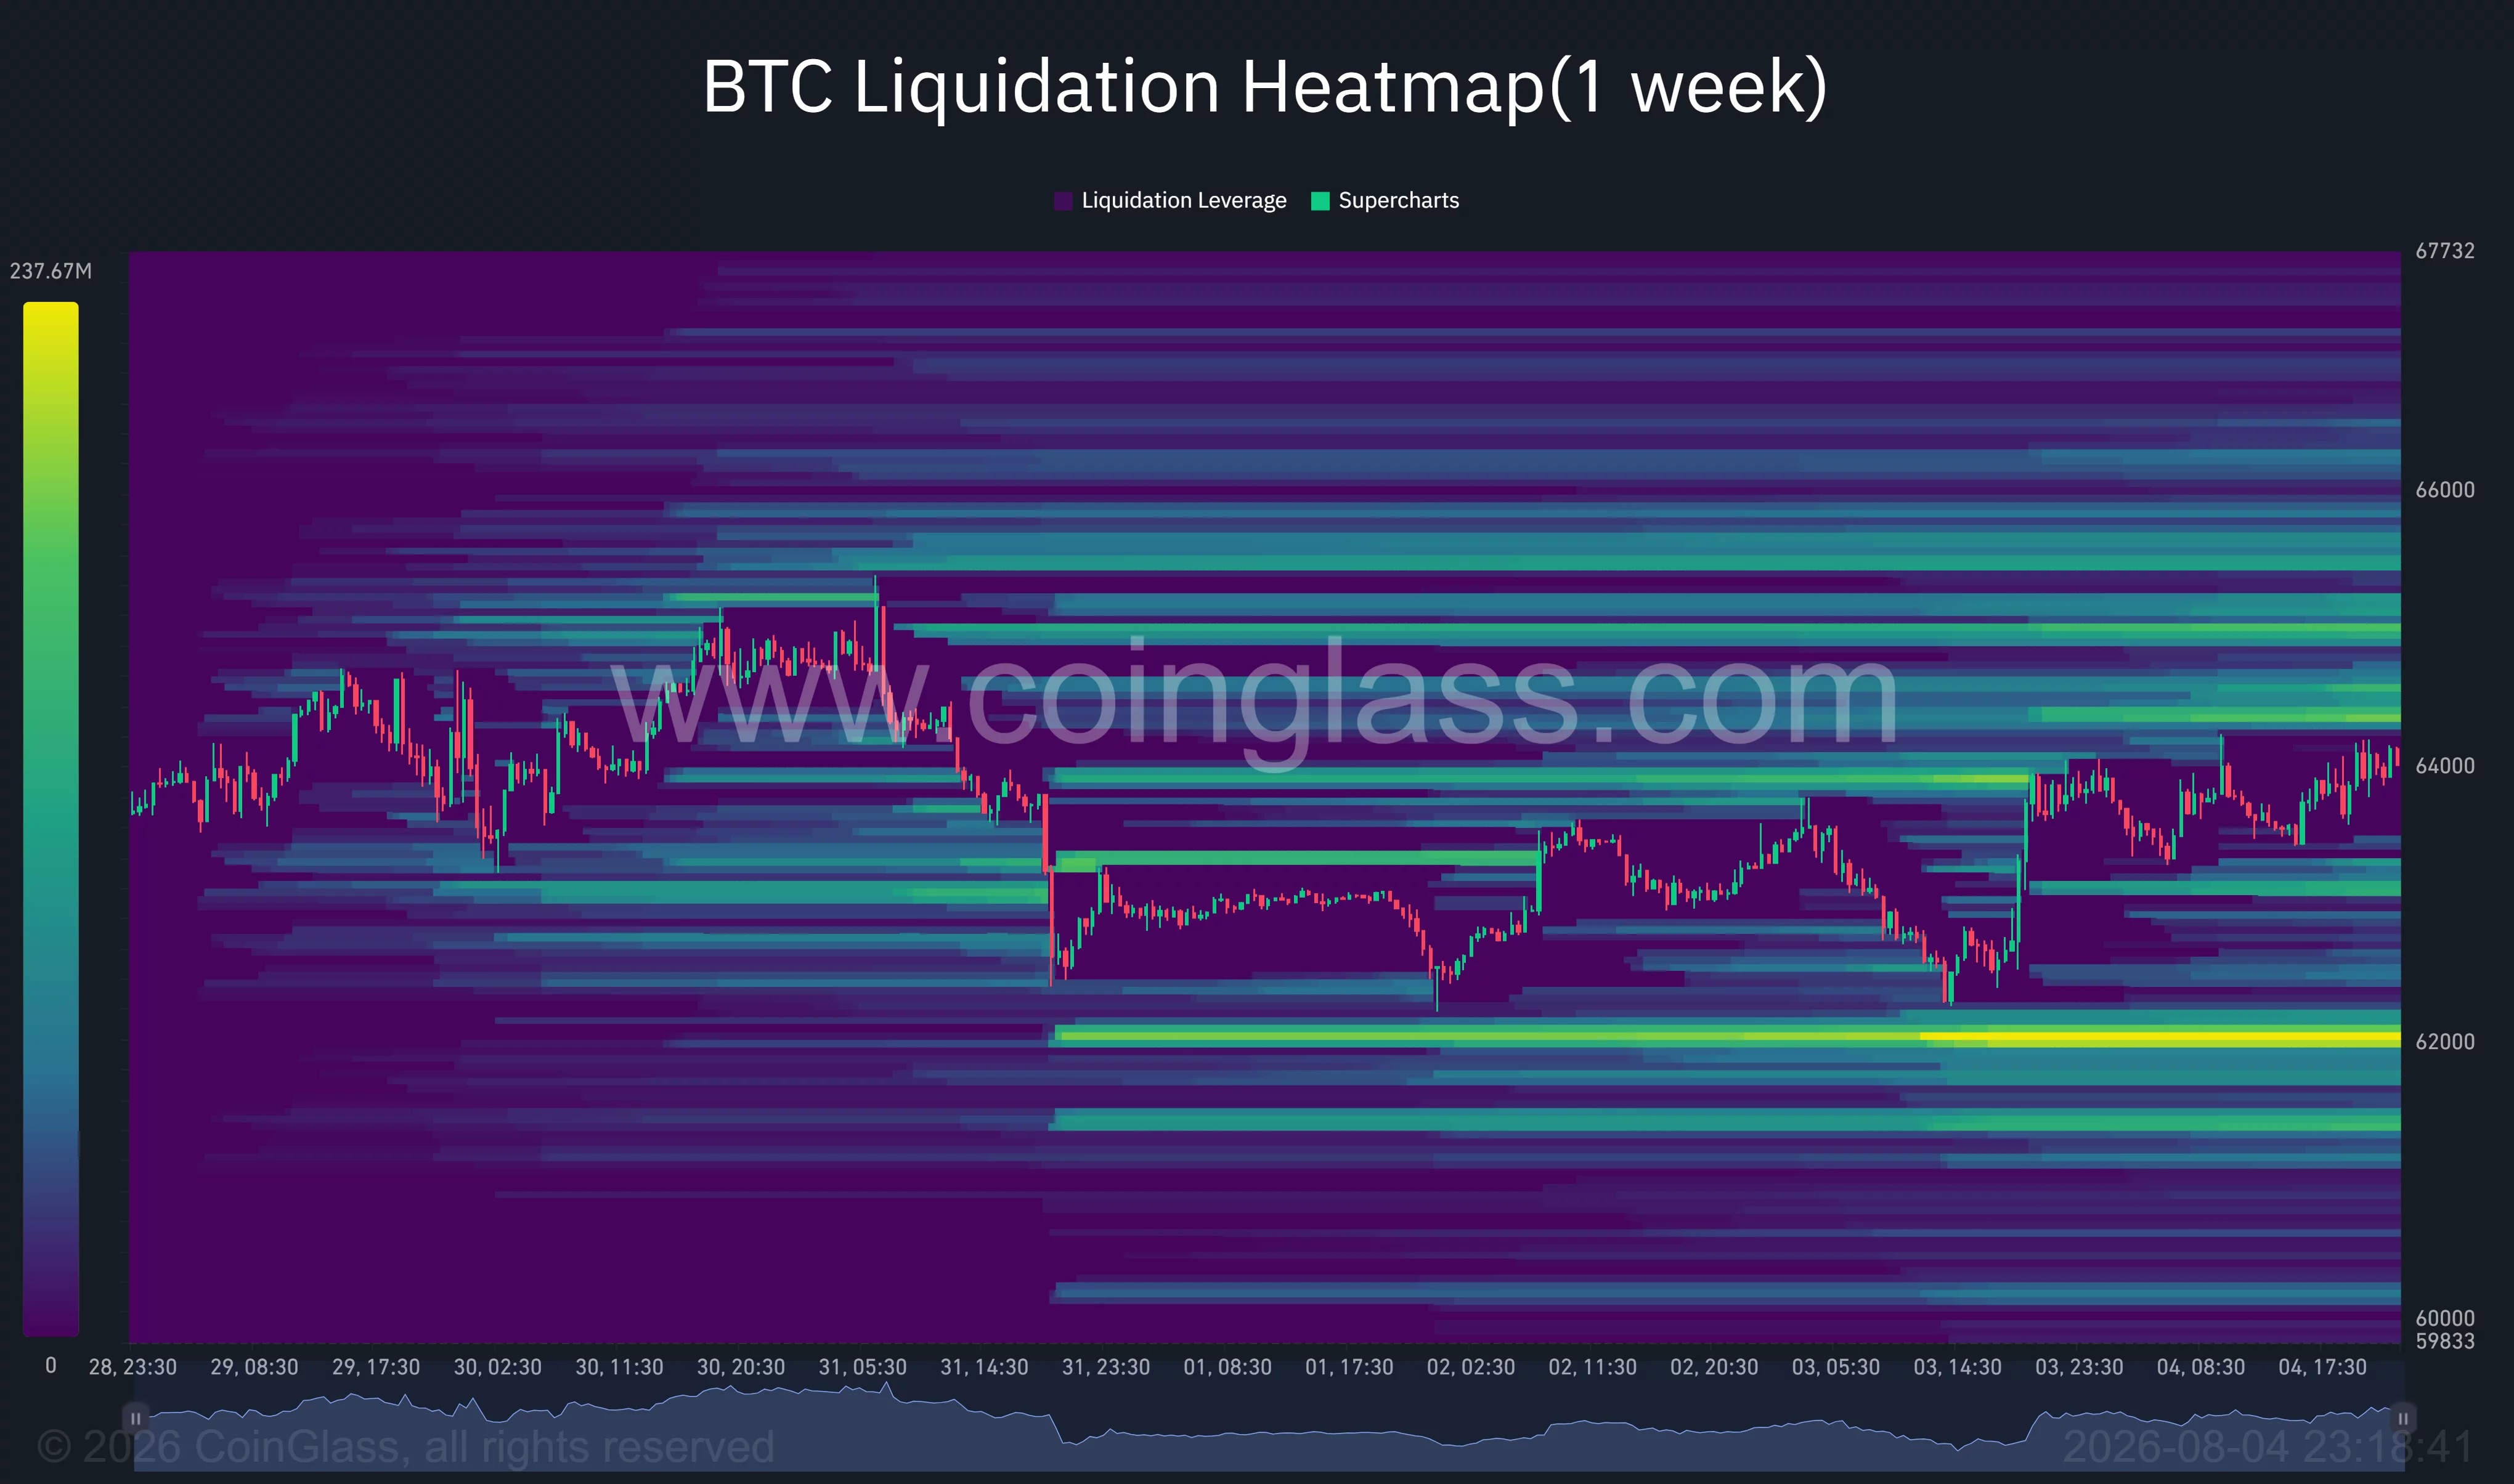
Smaller liquidity clusters appeared around $63,000, while several bands were visible above Bitcoin between $64,500 and $66,000. These levels could fuel a short squeeze if BTC closes above $64,300 and forces bearish positions to exit.
The bullish scenario depends on Bitcoin holding $63,496 and breaking the $64,300-$65,000 supply zone. That would support targets at $65,500, $66,500, and eventually $66,975.
The bearish scenario begins with a loss of $63,500. Such a move could expose $62,421, followed by the liquidation cluster near $62,000. A deeper decline would bring the $61,347 Fibonacci level back into focus.
US-Iran diplomacy may determine which liquidity zone Bitcoin reaches first. Continued progress toward a ceasefire could support a breakout, but stalled talks or renewed disruption in the Strait of Hormuz would leave the recovery vulnerable.
Disclosure: This article does not represent investment advice. The content and materials featured on this page are for educational purposes only.
